This is the multi-page printable view of this section.
Click here to print.
Return to the regular view of this page.
Prometheus Configuration
Prometheus is an open-source systems monitoring and alerting toolkit. It collects and stores metrics as time series data.
Best Practice
Any supported EKS Anywhere curated package should be modified through package yaml files (with kind: Package) and applied through the command kubectl apply -f packageFileName. Modifying objects outside of package yaml files may lead to unpredictable behaviors.
For automatic namespace (targetNamespace) creation, see createNamespace field: PackagebundleController.spec
Configuration options for Prometheus
1 - Prometheus with Grafana
This tutorial demonstrates how to config the Prometheus package to scrape metrics from an EKS Anywhere cluster, and visualize them in Grafana.
This tutorial walks through the following procedures:
Install the Prometheus package
The Prometheus package creates two components by default:
- Prometheus-server,
which collects metrics from configured targets, and stores the metrics as time series data;
- Node-exporter,
which exposes a wide variety of hardware- and kernel-related metrics for prometheus-server (or an equivalent metrics collector, i.e. ADOT collector) to scrape.
The prometheus-server is pre-configured to scrape the following targets at 1m interval:
- Kubernetes API servers
- Kubernetes nodes
- Kubernetes nodes cadvisor
- Kubernetes service endpoints
- Kubernetes services
- Kubernetes pods
- Prometheus-server itself
If no config modification is needed, a user can proceed to the Prometheus installation guide
.
Prometheus Package Customization
In this section, we cover a few frequently-asked config customizations. After determining the appropriate customization, proceed to the Prometheus installation guide
to complete the package installation. Also refer to Prometheus package spec
for additional config options.
Change prometheus-server global configs
By default, prometheus-server is configured with evaluation_interval: 1m, scrape_interval: 1m, scrape_timeout: 10s. Those values can be overwritten if preferred / needed.
The following config allows the user to do such customization:
apiVersion: packages.eks.amazonaws.com/v1alpha1
kind: Package
metadata:
  name: generated-prometheus
  namespace: eksa-packages-<cluster-name>
spec:
  packageName: prometheus
  config: |
    server:
      global:
        evaluation_interval: "30s"
        scrape_interval: "30s"
        scrape_timeout: "15s"
Run prometheus-server as statefulSets
By default, prometheus-server is created as a deployment with replicaCount equals to 1. If there is a need to increase the replicaCount greater than 1, a user should deploy prometheus-server as a statefulSet instead. This allows multiple prometheus-server pods to share the same data storage.
The following config allows the user to do such customization:
apiVersion: packages.eks.amazonaws.com/v1alpha1
kind: Package
metadata:
  name: generated-prometheus
  namespace: eksa-packages-<cluster-name>
spec:
  packageName: prometheus
  config: |
    server:
      replicaCount: 2
      statefulSet:
        enabled: true
Disable prometheus-server and use node-exporter only
A user may disable the prometheus-server when:
- they would like to use node-exporter to expose hardware- and kernel-related metrics, while
- they have deployed another metrics collector in the cluster and configured a remote-write storage solution, which fulfills the prometheus-server functionality (check out the ADOT with Amazon Managed Prometheus and Amazon Managed Grafana workshop
to learn how to do so).
The following config allows the user to do such customization:
    apiVersion: packages.eks.amazonaws.com/v1alpha1
    kind: Package
    metadata:
      name: generated-prometheus
      namespace: eksa-packages-<cluster-name>
    spec:
      packageName: prometheus
      config: |
        server:
          enabled: false
Disable node-exporter and use prometheus-server only
A user may disable the node-exporter when:
- they would like to deploy multiple prometheus-server packages for a cluster, while
- deploying only one or none node-exporter instance per node.
The following config allows the user to do such customization:
    apiVersion: packages.eks.amazonaws.com/v1alpha1
    kind: Package
    metadata:
      name: generated-prometheus
      namespace: eksa-packages-<cluster-name>
    spec:
      packageName: prometheus
      config: |
        nodeExporter:
          enabled: false
Prometheus Package Test
To ensure the Prometheus package is installed correctly in the cluster, a user can perform the following tests.
Access prometheus-server web UI
Port forward Prometheus to local host 9090:
export PROM_SERVER_POD_NAME=$(kubectl get pods --namespace <namespace> -l "app.kubernetes.io/name=prometheus,app.kubernetes.io/component=server" -o jsonpath="{.items[0].metadata.name")
kubectl port-forward $PROM_SERVER_POD_NAME -n <namespace> 9090
Go to http://localhost:9090
to access the web UI.
Run sample queries
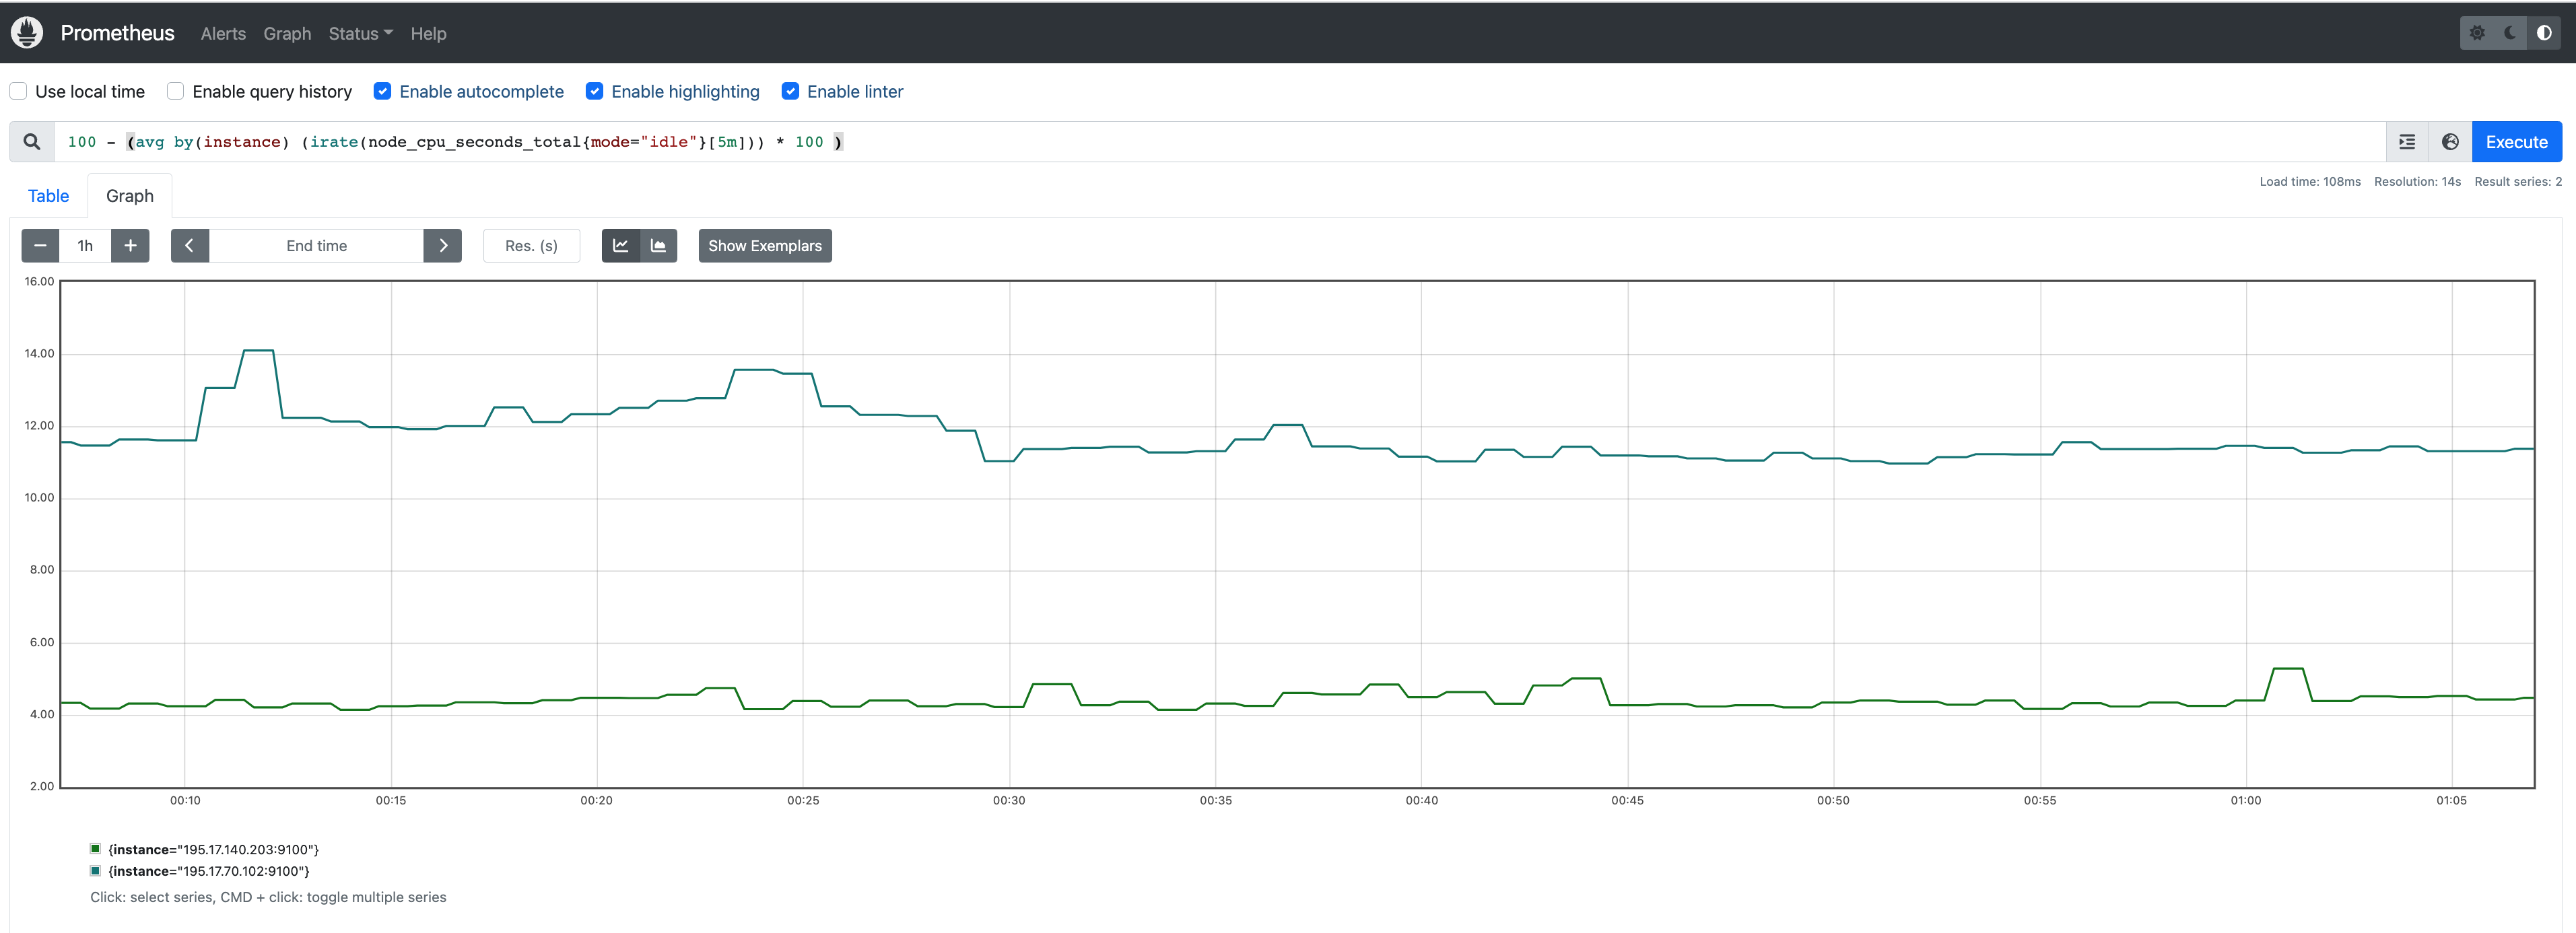
Run sample queries in Prometheus web UI to confirm the targets have been configured properly. For example, a user can run the following query to obtain the CPU utilization rate by node.
100 - (avg by(instance) (irate(node_cpu_seconds_total{mode="idle"}[5m])) * 100 )
The output will be displayed on the Graph tab.

Install Grafana helm charts
A user can install Grafana in the cluster to visualize the Prometheus metrics. We used the Grafana helm chart as an example below, though other deployment methods are also possible.
-
Get helm chart repo info
helm repo add grafana https://grafana.github.io/helm-charts
helm repo update
-
Install the helm chart
helm install my-grafana grafana/grafana
Set up Grafana dashboards
Access Grafana web UI
-
Obtain Grafana login password:
kubectl get secret --namespace default my-grafana -o jsonpath="{.data.admin-password}" | base64 --decode; echo
-
Port forward Grafana to local host 3000:
export GRAFANA_POD_NAME=$(kubectl get pods --namespace default -l "app.kubernetes.io/name=grafana,app.kubernetes.io/instance=my-grafana" -o jsonpath="{.items[0].metadata.name}")
kubectl --namespace default port-forward $GRAFANA_POD_NAME 3000
-
Go to http://localhost:3000
to access the web UI.
Log in with username admin, and password obtained from the Obtain Grafana login password in step 1 above.
Add Prometheus data source
-
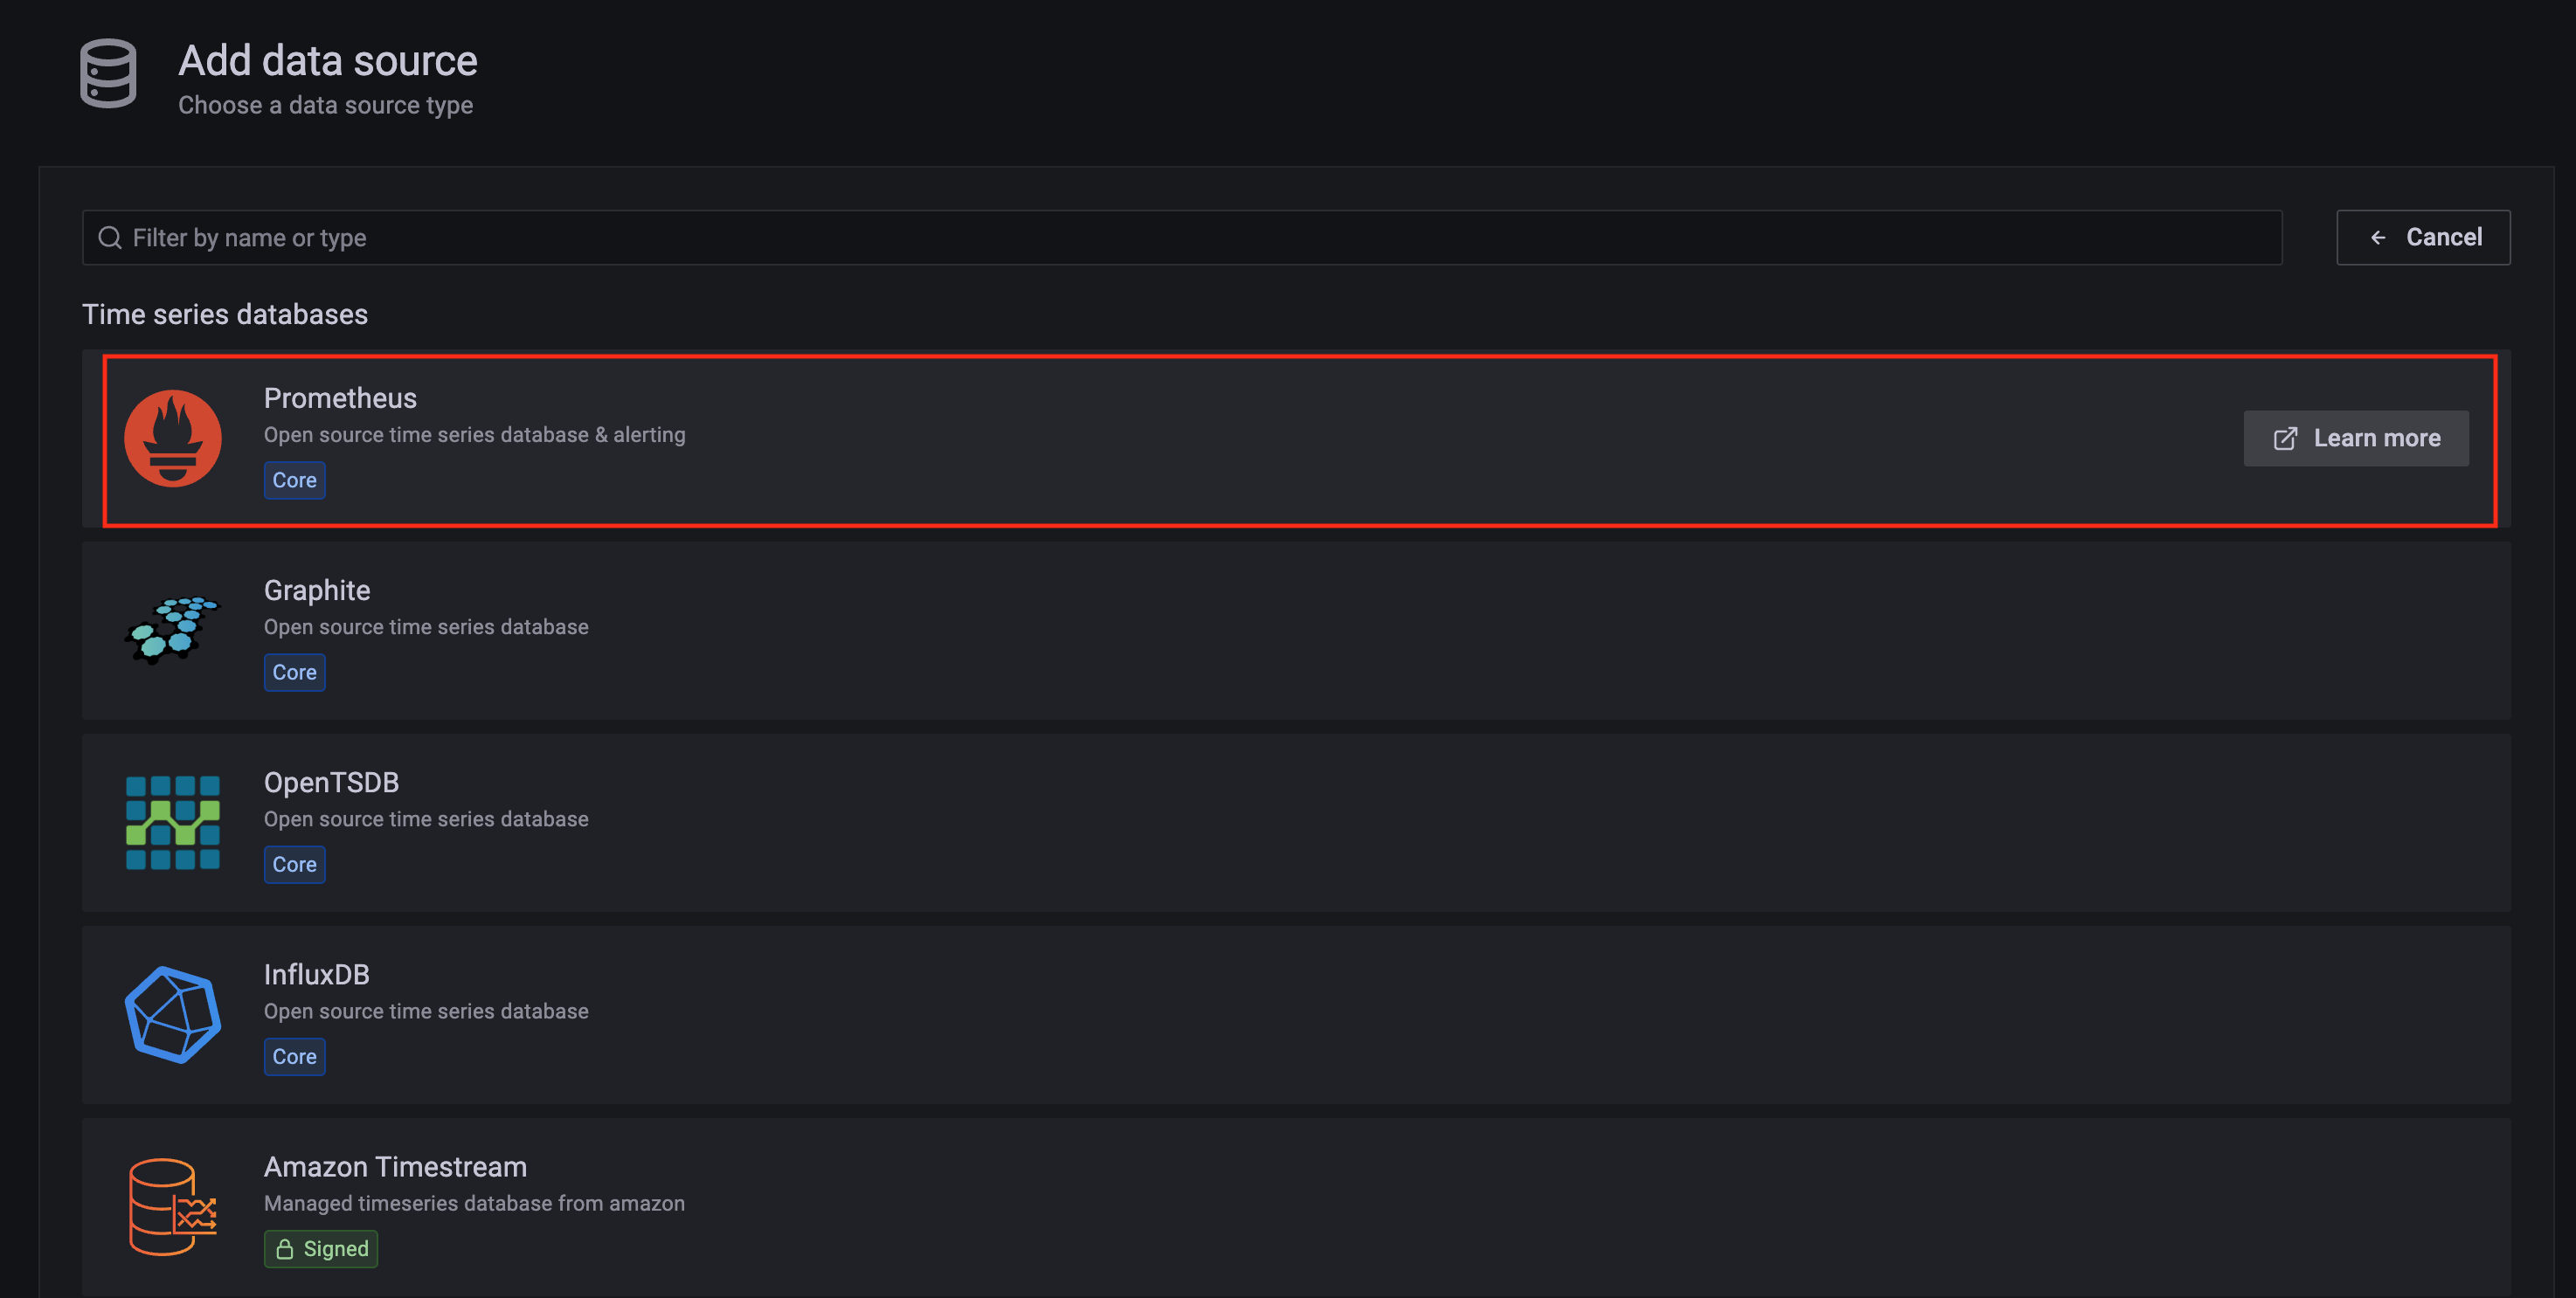
Click on the Configuration sign on the left navigation bar, select Data sources, then choose Prometheus as the Data source.

-
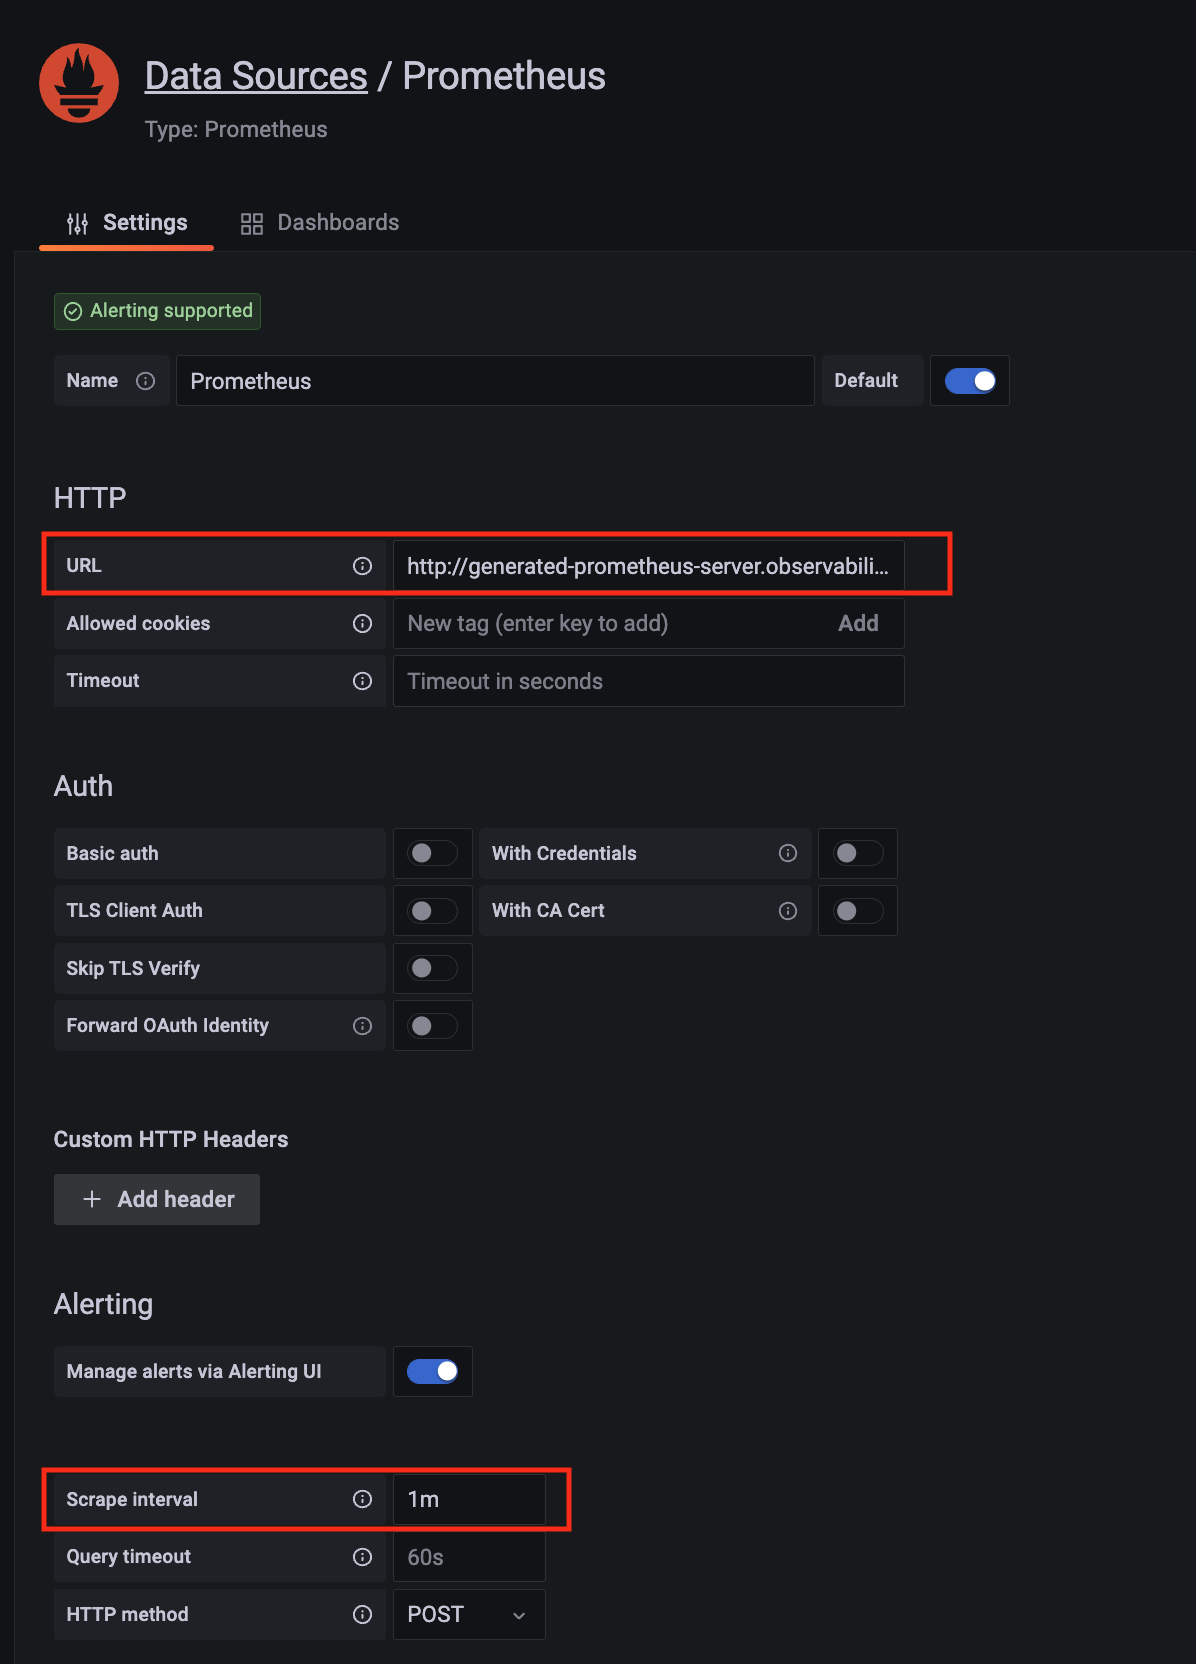
Configure Prometheus data source with the following details:
- Name:
Prometheus as an example.
- URL:
http://<prometheus-server-end-point-name>.<namespace>:9090. If the package default values are used, this will be http://generated-prometheus-server.observability:9090.
- Scrape interval:
1m or the value specified by user in the package config.
- Select
Save and test. A notification data source is working should be displayed.

Import dashboard templates
-
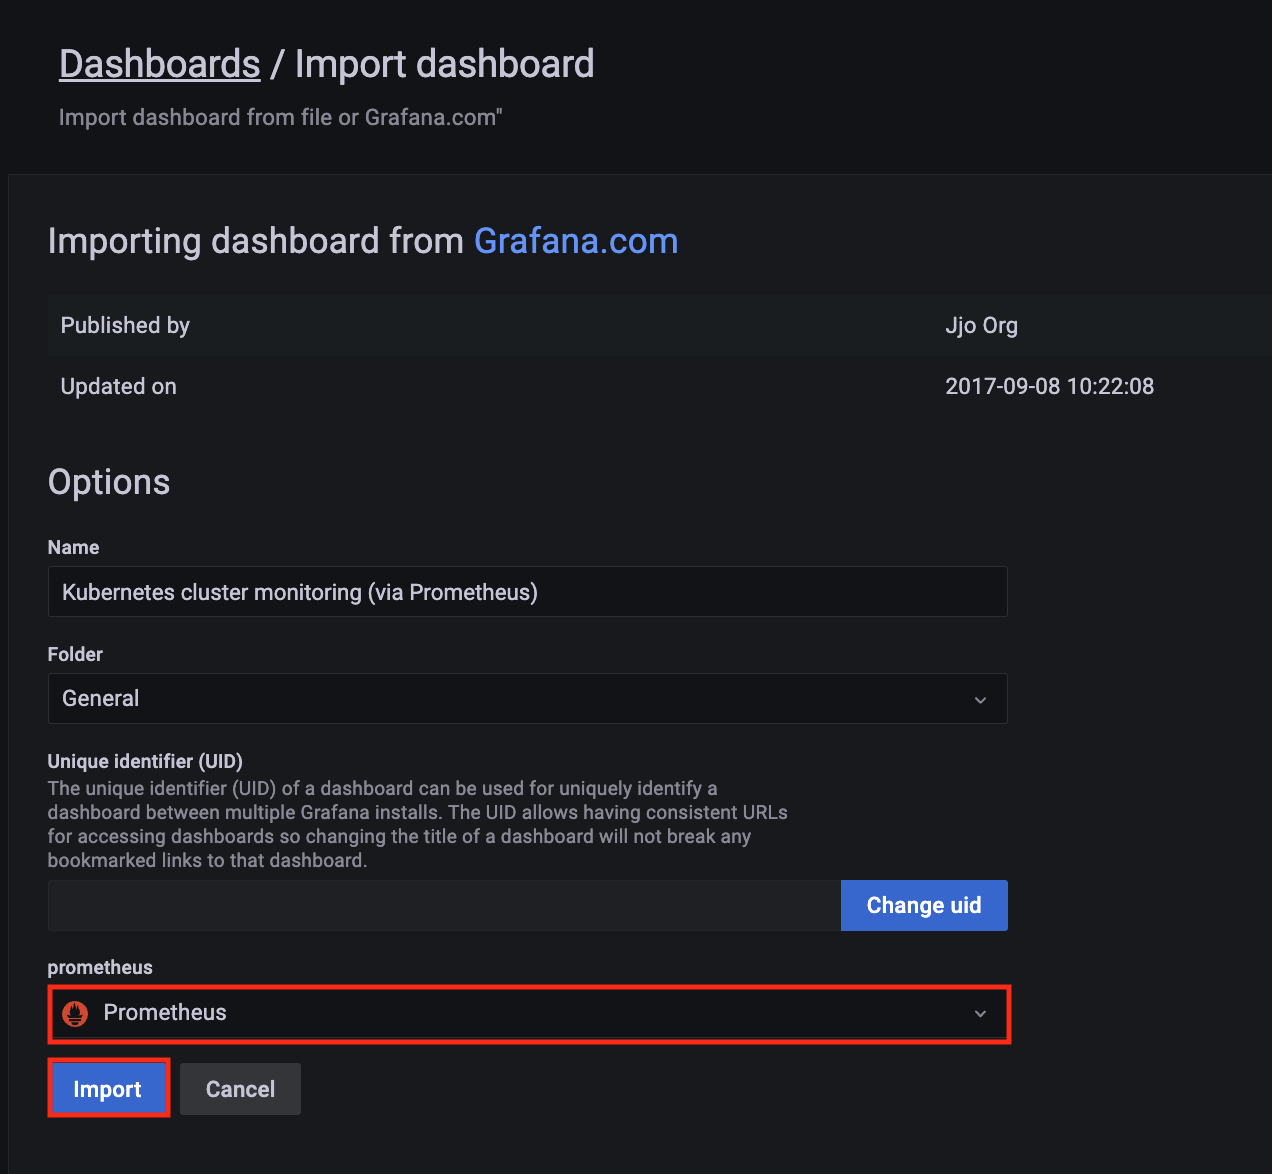
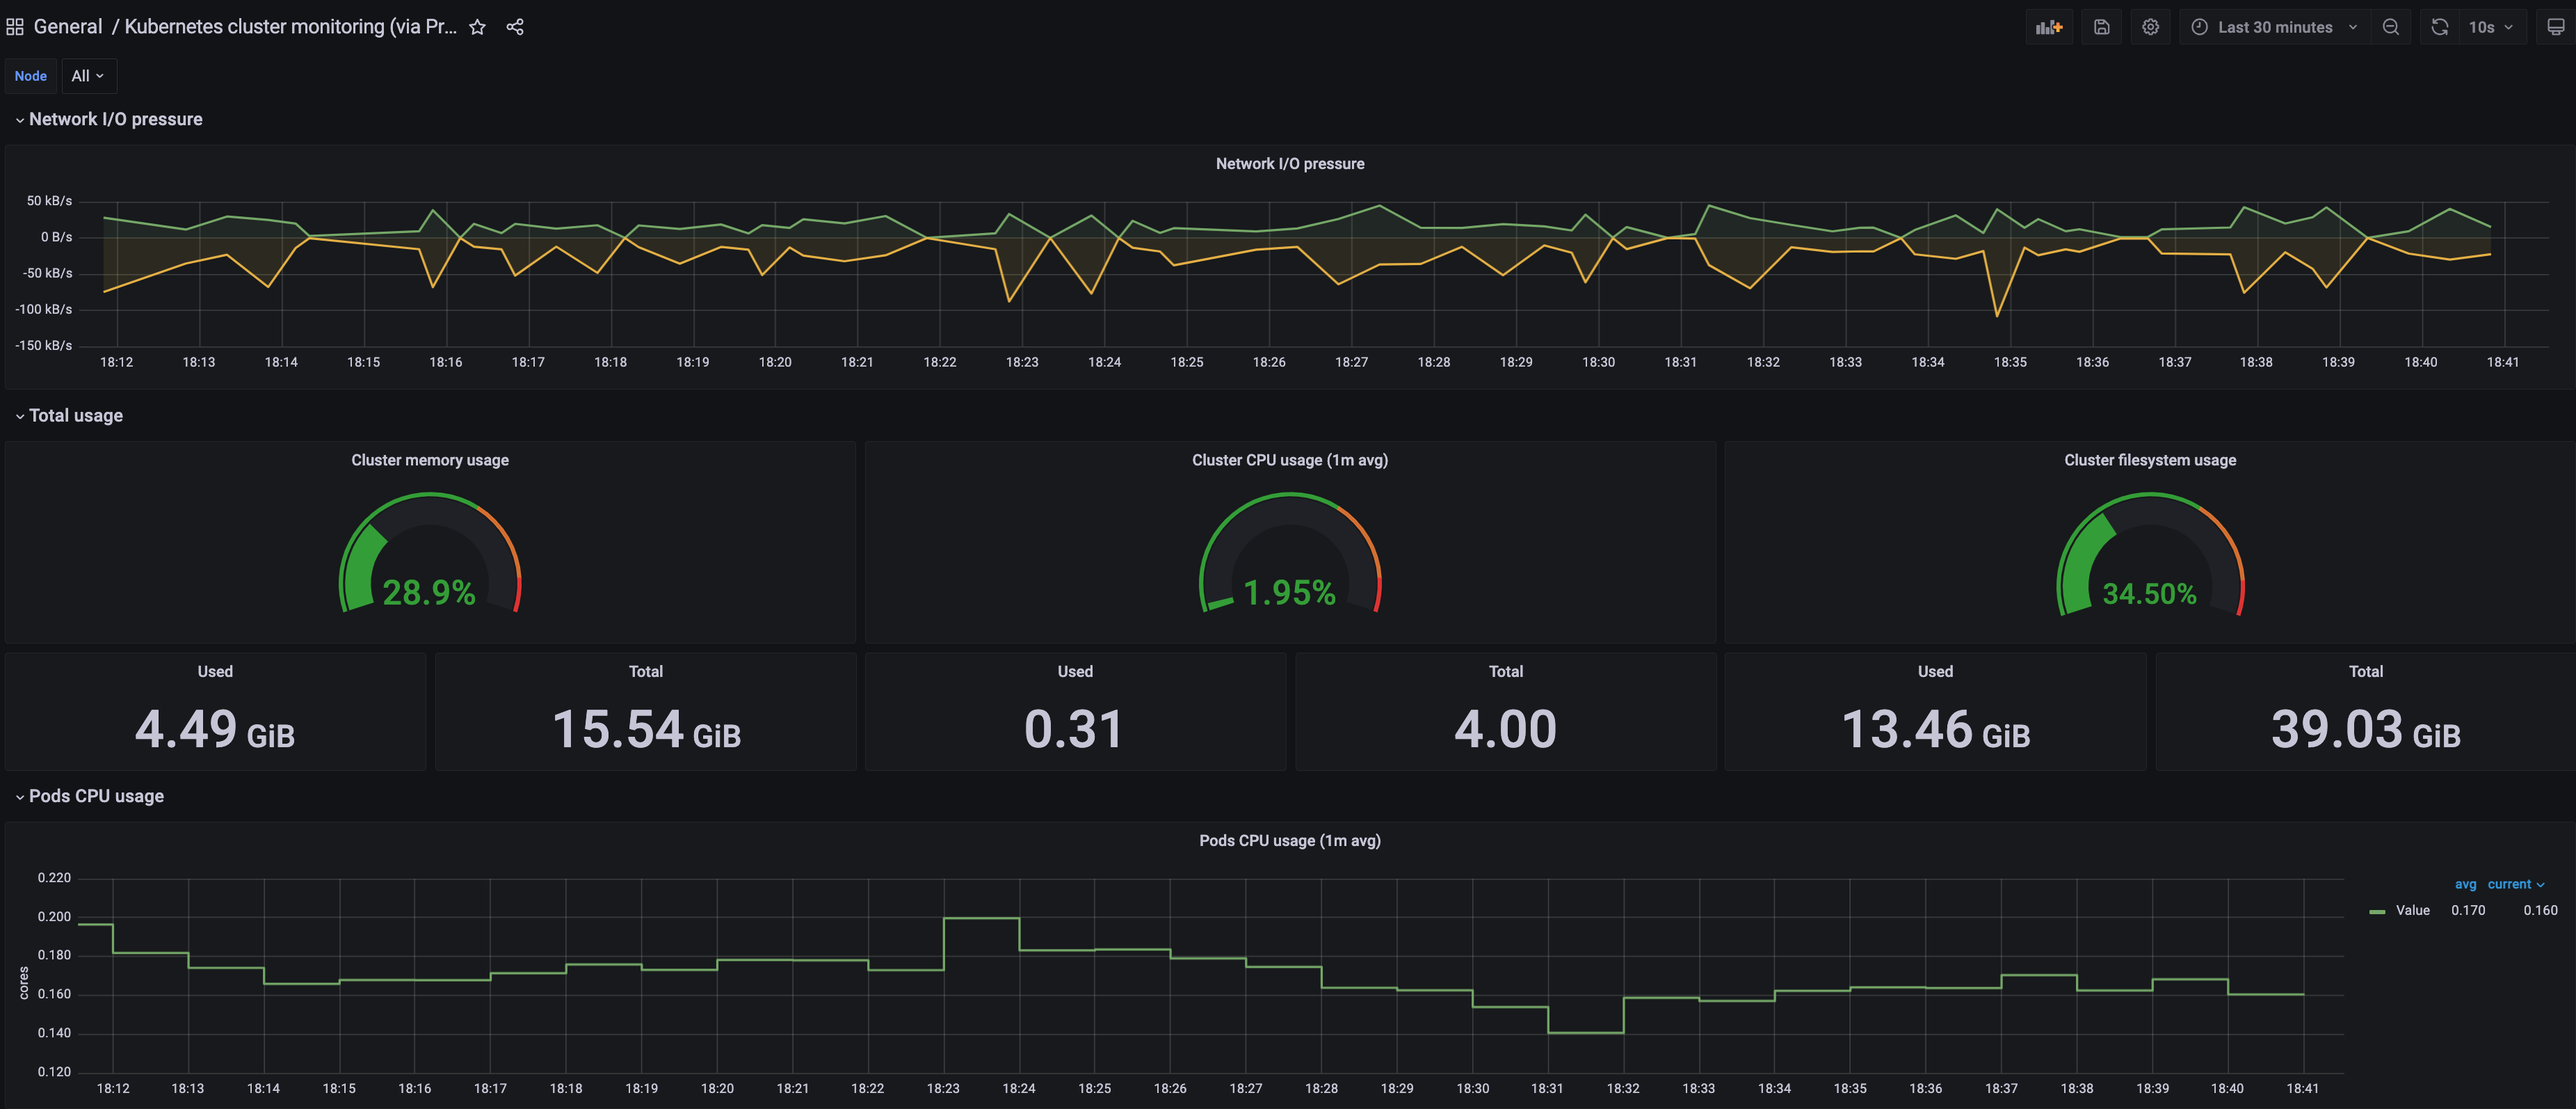
Import a dashboard template by hovering over to the Dashboard sign on the left navigation bar, and click on Import. Type 315 in the Import via grafana.com textbox and select Import.
From the dropdown at the bottom, select Prometheus and select Import.

-
A Kubernetes cluster monitoring (via Prometheus) dashboard will be displayed.

-
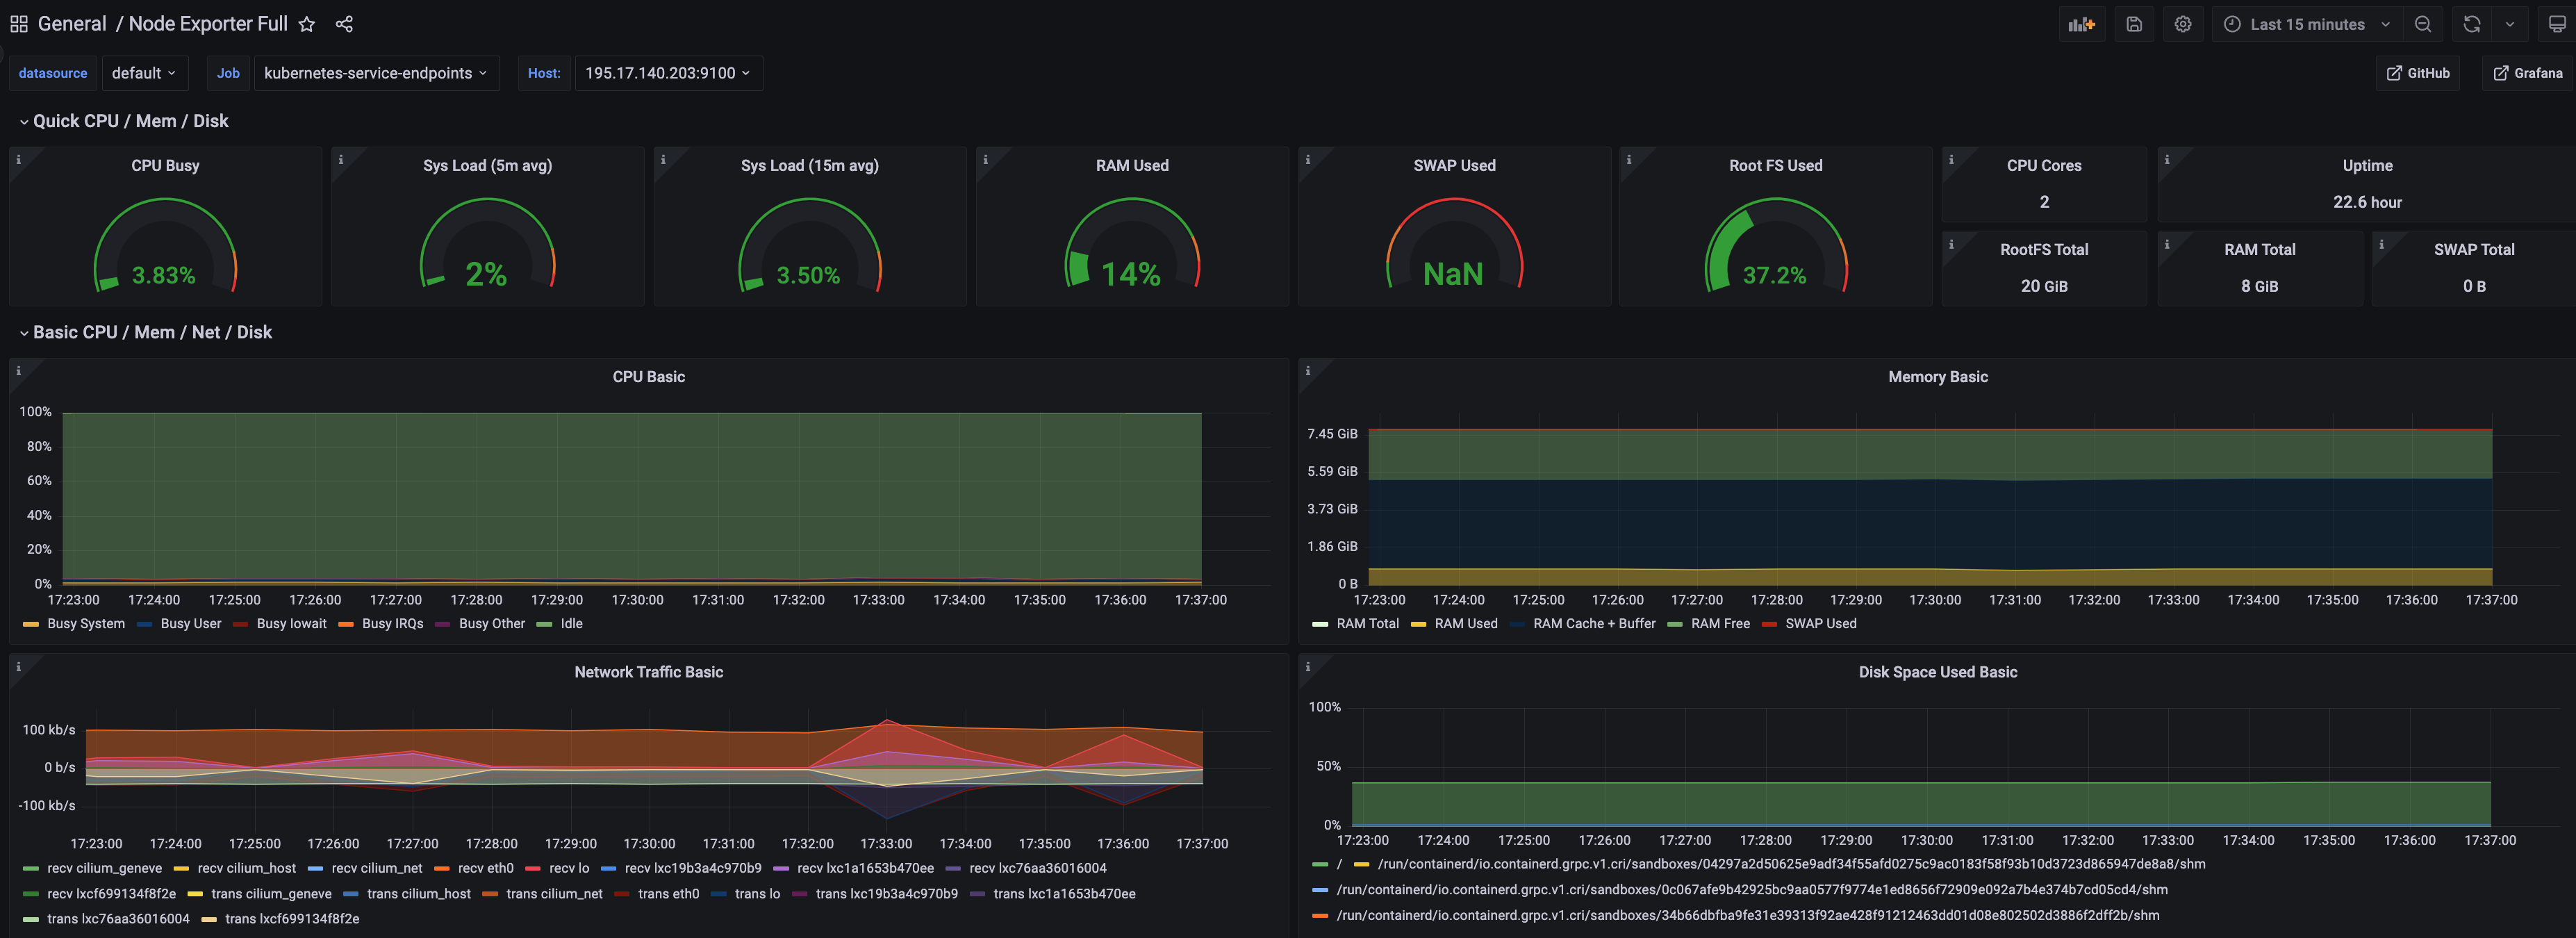
Perform the same procedure for template 1860. A Node Exporter Full dashboard will be displayed.

2 - Prometheus
Install/upgrade/uninstall Prometheus
If you have not already done so, make sure your cluster meets the package prerequisites.
Be sure to refer to the troubleshooting guide
in the event of a problem.
Important
- Starting at
eksctl anywhere version v0.12.0, packages on workload clusters are remotely managed by the management cluster.
- While following this guide to install packages on a workload cluster, please make sure the
kubeconfig is pointing to the management cluster that was used to create the workload cluster. The only exception is the kubectl create namespace command below, which should be run with kubeconfig pointing to the workload cluster.
Install
-
Generate the package configuration
eksctl anywhere generate package prometheus --cluster <cluster-name> > prometheus.yaml
-
Add the desired configuration to prometheus.yaml
Please see complete configuration options
for all configuration options and their default values.
Example package file with default configuration, which enables prometheus-server and node-exporter:
 apiVersion: packages.eks.amazonaws.com/v1alpha1
 kind: Package
 metadata:
   name: generated-prometheus
   namespace: eksa-packages-<cluster-name>
 spec:
   packageName: prometheus
Example package file with prometheus-server (or node-exporter) disabled:
 apiVersion: packages.eks.amazonaws.com/v1alpha1
 kind: Package
 metadata:
   name: generated-prometheus
   namespace: eksa-packages-<cluster-name>
 spec:
   packageName: prometheus
   config: |
     # disable prometheus-server
     server:
       enabled: false
     # or disable node-exporter
     # nodeExporter:
     #   enabled: false
Example package file with prometheus-server deployed as a statefulSet with replicaCount 2, and set scrape config to collect Prometheus-server’s own metrics only:
 apiVersion: packages.eks.amazonaws.com/v1alpha1
 kind: Package
 metadata:
   name: generated-prometheus
   namespace: eksa-packages-<cluster-name>
 spec:
   packageName: prometheus
   targetNamespace: observability
   config: |
     server:
       replicaCount: 2
       statefulSet:
         enabled: true
     serverFiles:
       prometheus.yml:
         scrape_configs:
           - job_name: prometheus
             static_configs:
               - targets:
                 - localhost:9090
-
Create the namespace
(If overriding targetNamespace, change observability to the value of targetNamespace)
kubectl create namespace observability
-
Install prometheus
eksctl anywhere create packages -f prometheus.yaml
-
Validate the installation
eksctl anywhere get packages --cluster <cluster-name>
Example command output
NAMESPACE                      NAME                   PACKAGE      AGE   STATE       CURRENTVERSION                                    TARGETVERSION                                              DETAIL
eksa-packages-<cluster-name>   generated-prometheus   prometheus   17m   installed   2.41.0-b53c8be243a6cc3ac2553de24ab9f726d9b851ca   2.41.0-b53c8be243a6cc3ac2553de24ab9f726d9b851ca (latest)
Update
To update package configuration, update prometheus.yaml file, and run the following command:
eksctl anywhere apply package -f prometheus.yaml
Upgrade
Prometheus will automatically be upgraded when a new bundle is activated.
Uninstall
To uninstall Prometheus, simply delete the package
eksctl anywhere delete package --cluster <cluster-name> generated-prometheus
3 - v2.39.1
Configuring Prometheus in EKS Anywhere package spec
Example
apiVersion: packages.eks.amazonaws.com/v1alpha1
kind: Package
metadata:
  name: generated-prometheus
  namespace: eksa-packages-<cluster-name>
spec:
  packageName: prometheus
  targetNamespace: observability
  config: |
    server:
      replicaCount: 2
      statefulSet:
        enabled: true
Configurable parameters and default values under spec.config
| Parameter |
Description |
Default |
| General |
|
|
| rbac.create |
Specifies if clusterRole / role and clusterRoleBinding / roleBinding will be created for prometheus-server and node-exporter |
true |
| sourceRegistry |
Specifies image source registry for prometheus-server and node-exporter |
"783794618700.dkr.ecr.us-west-2.amazonaws.com" |
| Node-Exporter |
|
|
| nodeExporter.enabled |
Indicates if node-exporter is enabled |
true |
| nodeExporter.hostNetwork |
Indicates if node-exporter shares the host network namespace |
true |
| nodeExporter.hostPID |
Indicates if node-exporter shares the host process ID namespace |
true |
| nodeExporter.image.pullPolicy |
Specifies node-exporter image pull policy: IfNotPresent, Always, Never |
"IfNotPresent" |
| nodeExporter.image.repository |
Specifies node-exporter image repository |
"prometheus/node-exporter" |
| nodeExporter.resources |
Specifies resource requests and limits of the node-exporter container. Refer to the Kubernetes API documentation ResourceRequirements
field for more details |
{} |
| nodeExporter.service |
Specifies how to expose node-exporter as a network service |
See footnote |
| nodeExporter.tolerations |
Specifies node tolerations for node-exporter scheduling to nodes with taints. Refer to the Kubernetes API documentation toleration
field for more details. |
See footnote |
| serviceAccounts.nodeExporter.annotations |
Specifies node-exporter service account annotations |
{} |
| serviceAccounts.nodeExporter.create |
Indicates if node-exporter service account will be created |
true |
| serviceAccounts.nodeExporter.name |
Specifies node-exporter service account name |
"" |
| Prometheus-Server |
|
|
| server.enabled |
Indicates if prometheus-server is enabled |
true |
| server.global.evaluation_interval |
Specifies how frequently the prometheus-server rules are evaluated |
"1m" |
| server.global.scrape_interval |
Specifies how frequently prometheus-server will scrape targets |
"1m" |
| server.global.scrape_timeout |
Specifies how long until a prometheus-server scrape request times out |
"10s" |
| server.image.pullPolicy |
Specifies prometheus-server image pull policy: IfNotPresent, Always, Never |
"IfNotPresent" |
| server.image.repository |
Specifies prometheus-server image repository |
"prometheus/prometheus" |
| server.name |
Specifies prometheus-server container name |
"server" |
| server.persistentVolume.accessModes |
Specifies prometheus-server data Persistent Volume access modes |
"ReadWriteOnce" |
| server.persistentVolume.enabled |
Indicates if prometheus-server will create/use a Persistent Volume Claim |
true |
| server.persistentVolume.existingClaim |
Specifies prometheus-server data Persistent Volume existing claim name. It requires server.persistentVolume.enabled: true. If defined, PVC must be created manually before volume will be bound |
"" |
| server.persistentVolume.size |
Specifies prometheus-server data Persistent Volume size |
"8Gi" |
| server.remoteRead |
Specifies prometheus-server remote read configs. Refer to Prometheus docs remote_read
for more details |
[] |
| server.remoteWrite |
Specifies prometheus-server remote write configs. Refer to Prometheus docs remote_write
for more details |
[] |
| server.replicaCount |
Specifies the replicaCount for prometheus-server deployment / statefulSet. Note: server.statefulSet.enabled should be set to true if server.replicaCount is greater than 1 |
1 |
| server.resources |
Specifies resource requests and limits of the prometheus-server container. Refer to the Kubernetes API documentation ResourceRequirements
field for more details |
{} |
| server.retention |
Specifies prometheus-server data retention period |
"15d" |
| server.service |
Specifies how to expose prometheus-server as a network service |
See footnote |
| server.statefulSet.enabled |
Indicates if prometheus-server is deployed as a statefulSet. If set to false, prometheus-server will be deployed as a deployment |
false |
| serverFiles.“prometheus.yml”.scrape_configs |
Specifies a set of targets and parameters for prometheus-server describing how to scrape them. Refer to Prometheus docs scrape_config
for more details |
See footnote |
| serviceAccounts.server.annotations |
Specifies prometheus-server service account annotations |
{} |
| serviceAccounts.server.create |
Indicates if prometheus-server service account will be created |
true |
| serviceAccounts.server.name |
Specifies prometheus-server service account name |
"" |
4 - v2.41.1
Configuring Prometheus in EKS Anywhere package spec
Example
apiVersion: packages.eks.amazonaws.com/v1alpha1
kind: Package
metadata:
  name: generated-prometheus
  namespace: eksa-packages-<cluster-name>
spec:
  packageName: prometheus
  targetNamespace: observability
  config: |
    server:
      replicaCount: 2
      statefulSet:
        enabled: true
Configurable parameters and default values under spec.config
| Parameter |
Description |
Default |
| General |
|
|
| rbac.create |
Specifies if clusterRole / role and clusterRoleBinding / roleBinding will be created for prometheus-server and node-exporter |
true |
| sourceRegistry |
Specifies image source registry for prometheus-server and node-exporter |
"783794618700.dkr.ecr.us-west-2.amazonaws.com" |
| Node-Exporter |
|
|
| nodeExporter.enabled |
Indicates if node-exporter is enabled |
true |
| nodeExporter.hostNetwork |
Indicates if node-exporter shares the host network namespace |
true |
| nodeExporter.hostPID |
Indicates if node-exporter shares the host process ID namespace |
true |
| nodeExporter.image.pullPolicy |
Specifies node-exporter image pull policy: IfNotPresent, Always, Never |
"IfNotPresent" |
| nodeExporter.image.repository |
Specifies node-exporter image repository |
"prometheus/node-exporter" |
| nodeExporter.resources |
Specifies resource requests and limits of the node-exporter container. Refer to the Kubernetes API documentation ResourceRequirements
field for more details |
{} |
| nodeExporter.service |
Specifies how to expose node-exporter as a network service |
See footnote |
| nodeExporter.tolerations |
Specifies node tolerations for node-exporter scheduling to nodes with taints. Refer to the Kubernetes API documentation toleration
field for more details. |
See footnote |
| serviceAccounts.nodeExporter.annotations |
Specifies node-exporter service account annotations |
{} |
| serviceAccounts.nodeExporter.create |
Indicates if node-exporter service account will be created |
true |
| serviceAccounts.nodeExporter.name |
Specifies node-exporter service account name |
"" |
| Prometheus-Server |
|
|
| server.enabled |
Indicates if prometheus-server is enabled |
true |
| server.global.evaluation_interval |
Specifies how frequently the prometheus-server rules are evaluated |
"1m" |
| server.global.scrape_interval |
Specifies how frequently prometheus-server will scrape targets |
"1m" |
| server.global.scrape_timeout |
Specifies how long until a prometheus-server scrape request times out |
"10s" |
| server.image.pullPolicy |
Specifies prometheus-server image pull policy: IfNotPresent, Always, Never |
"IfNotPresent" |
| server.image.repository |
Specifies prometheus-server image repository |
"prometheus/prometheus" |
| server.name |
Specifies prometheus-server container name |
"server" |
| server.persistentVolume.accessModes |
Specifies prometheus-server data Persistent Volume access modes |
"ReadWriteOnce" |
| server.persistentVolume.enabled |
Indicates if prometheus-server will create/use a Persistent Volume Claim |
true |
| server.persistentVolume.existingClaim |
Specifies prometheus-server data Persistent Volume existing claim name. It requires server.persistentVolume.enabled: true. If defined, PVC must be created manually before volume will be bound |
"" |
| server.persistentVolume.size |
Specifies prometheus-server data Persistent Volume size |
"8Gi" |
| server.remoteRead |
Specifies prometheus-server remote read configs. Refer to Prometheus docs remote_read
for more details |
[] |
| server.remoteWrite |
Specifies prometheus-server remote write configs. Refer to Prometheus docs remote_write
for more details |
[] |
| server.replicaCount |
Specifies the replicaCount for prometheus-server deployment / statefulSet. Note: server.statefulSet.enabled should be set to true if server.replicaCount is greater than 1 |
1 |
| server.resources |
Specifies resource requests and limits of the prometheus-server container. Refer to the Kubernetes API documentation ResourceRequirements
field for more details |
{} |
| server.retention |
Specifies prometheus-server data retention period |
"15d" |
| server.service |
Specifies how to expose prometheus-server as a network service |
See footnote |
| server.statefulSet.enabled |
Indicates if prometheus-server is deployed as a statefulSet. If set to false, prometheus-server will be deployed as a deployment |
false |
| serverFiles.“prometheus.yml”.scrape_configs |
Specifies a set of targets and parameters for prometheus-server describing how to scrape them. Refer to Prometheus docs scrape_config
for more details |
See footnote |
| serviceAccounts.server.annotations |
Specifies prometheus-server service account annotations |
{} |
| serviceAccounts.server.create |
Indicates if prometheus-server service account will be created |
true |
| serviceAccounts.server.name |
Specifies prometheus-server service account name |
"" |
5 - v2.52.0
Configuring Prometheus in EKS Anywhere package spec
Example
apiVersion: packages.eks.amazonaws.com/v1alpha1
kind: Package
metadata:
  name: generated-prometheus
  namespace: eksa-packages-<cluster-name>
spec:
  packageName: prometheus
  targetNamespace: observability
  config: |
    server:
      replicaCount: 2
      statefulSet:
        enabled: true
Configurable parameters and default values under spec.config
| Parameter |
Description |
Default |
| General |
|
|
| rbac.create |
Specifies if clusterRole / role and clusterRoleBinding / roleBinding will be created for prometheus-server and node-exporter |
true |
| sourceRegistry |
Specifies image source registry for prometheus-server and node-exporter |
"783794618700.dkr.ecr.us-west-2.amazonaws.com" |
| Node-Exporter |
|
|
| nodeExporter.enabled |
Indicates if node-exporter is enabled |
true |
| nodeExporter.hostNetwork |
Indicates if node-exporter shares the host network namespace |
true |
| nodeExporter.hostPID |
Indicates if node-exporter shares the host process ID namespace |
true |
| nodeExporter.image.pullPolicy |
Specifies node-exporter image pull policy: IfNotPresent, Always, Never |
"IfNotPresent" |
| nodeExporter.image.repository |
Specifies node-exporter image repository |
"prometheus/node-exporter" |
| nodeExporter.resources |
Specifies resource requests and limits of the node-exporter container. Refer to the Kubernetes API documentation ResourceRequirements
field for more details |
{} |
| nodeExporter.service |
Specifies how to expose node-exporter as a network service |
See footnote |
| nodeExporter.tolerations |
Specifies node tolerations for node-exporter scheduling to nodes with taints. Refer to the Kubernetes API documentation toleration
field for more details. |
See footnote |
| serviceAccounts.nodeExporter.annotations |
Specifies node-exporter service account annotations |
{} |
| serviceAccounts.nodeExporter.create |
Indicates if node-exporter service account will be created |
true |
| serviceAccounts.nodeExporter.name |
Specifies node-exporter service account name |
"" |
| Prometheus-Server |
|
|
| server.enabled |
Indicates if prometheus-server is enabled |
true |
| server.global.evaluation_interval |
Specifies how frequently the prometheus-server rules are evaluated |
"1m" |
| server.global.scrape_interval |
Specifies how frequently prometheus-server will scrape targets |
"1m" |
| server.global.scrape_timeout |
Specifies how long until a prometheus-server scrape request times out |
"10s" |
| server.image.pullPolicy |
Specifies prometheus-server image pull policy: IfNotPresent, Always, Never |
"IfNotPresent" |
| server.image.repository |
Specifies prometheus-server image repository |
"prometheus/prometheus" |
| server.name |
Specifies prometheus-server container name |
"server" |
| server.persistentVolume.accessModes |
Specifies prometheus-server data Persistent Volume access modes |
"ReadWriteOnce" |
| server.persistentVolume.enabled |
Indicates if prometheus-server will create/use a Persistent Volume Claim |
true |
| server.persistentVolume.existingClaim |
Specifies prometheus-server data Persistent Volume existing claim name. It requires server.persistentVolume.enabled: true. If defined, PVC must be created manually before volume will be bound |
"" |
| server.persistentVolume.size |
Specifies prometheus-server data Persistent Volume size |
"8Gi" |
| server.remoteRead |
Specifies prometheus-server remote read configs. Refer to Prometheus docs remote_read
for more details |
[] |
| server.remoteWrite |
Specifies prometheus-server remote write configs. Refer to Prometheus docs remote_write
for more details |
[] |
| server.replicaCount |
Specifies the replicaCount for prometheus-server deployment / statefulSet. Note: server.statefulSet.enabled should be set to true if server.replicaCount is greater than 1 |
1 |
| server.resources |
Specifies resource requests and limits of the prometheus-server container. Refer to the Kubernetes API documentation ResourceRequirements
field for more details |
{} |
| server.retention |
Specifies prometheus-server data retention period |
"15d" |
| server.service |
Specifies how to expose prometheus-server as a network service |
See footnote |
| server.statefulSet.enabled |
Indicates if prometheus-server is deployed as a statefulSet. If set to false, prometheus-server will be deployed as a deployment |
false |
| serverFiles.“prometheus.yml”.scrape_configs |
Specifies a set of targets and parameters for prometheus-server describing how to scrape them. Refer to Prometheus docs scrape_config
for more details |
See footnote |
| serviceAccounts.server.annotations |
Specifies prometheus-server service account annotations |
{} |
| serviceAccounts.server.create |
Indicates if prometheus-server service account will be created |
true |
| serviceAccounts.server.name |
Specifies prometheus-server service account name |
"" |
6 - v2.54.1
Configuring Prometheus in EKS Anywhere package spec
Example
apiVersion: packages.eks.amazonaws.com/v1alpha1
kind: Package
metadata:
  name: generated-prometheus
  namespace: eksa-packages-<cluster-name>
spec:
  packageName: prometheus
  targetNamespace: observability
  config: |
    server:
      replicaCount: 2
      statefulSet:
        enabled: true
Configurable parameters and default values under spec.config
| Parameter |
Description |
Default |
| General |
|
|
| rbac.create |
Specifies if clusterRole / role and clusterRoleBinding / roleBinding will be created for prometheus-server and node-exporter |
true |
| sourceRegistry |
Specifies image source registry for prometheus-server and node-exporter |
"783794618700.dkr.ecr.us-west-2.amazonaws.com" |
| Node-Exporter |
|
|
| nodeExporter.enabled |
Indicates if node-exporter is enabled |
true |
| nodeExporter.hostNetwork |
Indicates if node-exporter shares the host network namespace |
true |
| nodeExporter.hostPID |
Indicates if node-exporter shares the host process ID namespace |
true |
| nodeExporter.image.pullPolicy |
Specifies node-exporter image pull policy: IfNotPresent, Always, Never |
"IfNotPresent" |
| nodeExporter.image.repository |
Specifies node-exporter image repository |
"prometheus/node-exporter" |
| nodeExporter.resources |
Specifies resource requests and limits of the node-exporter container. Refer to the Kubernetes API documentation ResourceRequirements
field for more details |
{} |
| nodeExporter.service |
Specifies how to expose node-exporter as a network service |
See footnote |
| nodeExporter.tolerations |
Specifies node tolerations for node-exporter scheduling to nodes with taints. Refer to the Kubernetes API documentation toleration
field for more details. |
See footnote |
| serviceAccounts.nodeExporter.annotations |
Specifies node-exporter service account annotations |
{} |
| serviceAccounts.nodeExporter.create |
Indicates if node-exporter service account will be created |
true |
| serviceAccounts.nodeExporter.name |
Specifies node-exporter service account name |
"" |
| Prometheus-Server |
|
|
| server.enabled |
Indicates if prometheus-server is enabled |
true |
| server.global.evaluation_interval |
Specifies how frequently the prometheus-server rules are evaluated |
"1m" |
| server.global.scrape_interval |
Specifies how frequently prometheus-server will scrape targets |
"1m" |
| server.global.scrape_timeout |
Specifies how long until a prometheus-server scrape request times out |
"10s" |
| server.image.pullPolicy |
Specifies prometheus-server image pull policy: IfNotPresent, Always, Never |
"IfNotPresent" |
| server.image.repository |
Specifies prometheus-server image repository |
"prometheus/prometheus" |
| server.name |
Specifies prometheus-server container name |
"server" |
| server.persistentVolume.accessModes |
Specifies prometheus-server data Persistent Volume access modes |
"ReadWriteOnce" |
| server.persistentVolume.enabled |
Indicates if prometheus-server will create/use a Persistent Volume Claim |
true |
| server.persistentVolume.existingClaim |
Specifies prometheus-server data Persistent Volume existing claim name. It requires server.persistentVolume.enabled: true. If defined, PVC must be created manually before volume will be bound |
"" |
| server.persistentVolume.size |
Specifies prometheus-server data Persistent Volume size |
"8Gi" |
| server.remoteRead |
Specifies prometheus-server remote read configs. Refer to Prometheus docs remote_read
for more details |
[] |
| server.remoteWrite |
Specifies prometheus-server remote write configs. Refer to Prometheus docs remote_write
for more details |
[] |
| server.replicaCount |
Specifies the replicaCount for prometheus-server deployment / statefulSet. Note: server.statefulSet.enabled should be set to true if server.replicaCount is greater than 1 |
1 |
| server.resources |
Specifies resource requests and limits of the prometheus-server container. Refer to the Kubernetes API documentation ResourceRequirements
field for more details |
{} |
| server.retention |
Specifies prometheus-server data retention period |
"15d" |
| server.service |
Specifies how to expose prometheus-server as a network service |
See footnote |
| server.statefulSet.enabled |
Indicates if prometheus-server is deployed as a statefulSet. If set to false, prometheus-server will be deployed as a deployment |
false |
| serverFiles.“prometheus.yml”.scrape_configs |
Specifies a set of targets and parameters for prometheus-server describing how to scrape them. Refer to Prometheus docs scrape_config
for more details |
See footnote |
| serviceAccounts.server.annotations |
Specifies prometheus-server service account annotations |
{} |
| serviceAccounts.server.create |
Indicates if prometheus-server service account will be created |
true |
| serviceAccounts.server.name |
Specifies prometheus-server service account name |
"" |
7 - v2.55.1
Configuring Prometheus in EKS Anywhere package spec
Example
apiVersion: packages.eks.amazonaws.com/v1alpha1
kind: Package
metadata:
  name: generated-prometheus
  namespace: eksa-packages-<cluster-name>
spec:
  packageName: prometheus
  targetNamespace: observability
  config: |
    server:
      replicaCount: 2
      statefulSet:
        enabled: true
Configurable parameters and default values under spec.config
| Parameter |
Description |
Default |
| General |
|
|
| rbac.create |
Specifies if clusterRole / role and clusterRoleBinding / roleBinding will be created for prometheus-server and node-exporter |
true |
| sourceRegistry |
Specifies image source registry for prometheus-server and node-exporter |
"783794618700.dkr.ecr.us-west-2.amazonaws.com" |
| Node-Exporter |
|
|
| nodeExporter.enabled |
Indicates if node-exporter is enabled |
true |
| nodeExporter.hostNetwork |
Indicates if node-exporter shares the host network namespace |
true |
| nodeExporter.hostPID |
Indicates if node-exporter shares the host process ID namespace |
true |
| nodeExporter.image.pullPolicy |
Specifies node-exporter image pull policy: IfNotPresent, Always, Never |
"IfNotPresent" |
| nodeExporter.image.repository |
Specifies node-exporter image repository |
"prometheus/node-exporter" |
| nodeExporter.resources |
Specifies resource requests and limits of the node-exporter container. Refer to the Kubernetes API documentation ResourceRequirements
field for more details |
{} |
| nodeExporter.service |
Specifies how to expose node-exporter as a network service |
See footnote |
| nodeExporter.tolerations |
Specifies node tolerations for node-exporter scheduling to nodes with taints. Refer to the Kubernetes API documentation toleration
field for more details. |
See footnote |
| serviceAccounts.nodeExporter.annotations |
Specifies node-exporter service account annotations |
{} |
| serviceAccounts.nodeExporter.create |
Indicates if node-exporter service account will be created |
true |
| serviceAccounts.nodeExporter.name |
Specifies node-exporter service account name |
"" |
| Prometheus-Server |
|
|
| server.enabled |
Indicates if prometheus-server is enabled |
true |
| server.global.evaluation_interval |
Specifies how frequently the prometheus-server rules are evaluated |
"1m" |
| server.global.scrape_interval |
Specifies how frequently prometheus-server will scrape targets |
"1m" |
| server.global.scrape_timeout |
Specifies how long until a prometheus-server scrape request times out |
"10s" |
| server.image.pullPolicy |
Specifies prometheus-server image pull policy: IfNotPresent, Always, Never |
"IfNotPresent" |
| server.image.repository |
Specifies prometheus-server image repository |
"prometheus/prometheus" |
| server.name |
Specifies prometheus-server container name |
"server" |
| server.persistentVolume.accessModes |
Specifies prometheus-server data Persistent Volume access modes |
"ReadWriteOnce" |
| server.persistentVolume.enabled |
Indicates if prometheus-server will create/use a Persistent Volume Claim |
true |
| server.persistentVolume.existingClaim |
Specifies prometheus-server data Persistent Volume existing claim name. It requires server.persistentVolume.enabled: true. If defined, PVC must be created manually before volume will be bound |
"" |
| server.persistentVolume.size |
Specifies prometheus-server data Persistent Volume size |
"8Gi" |
| server.remoteRead |
Specifies prometheus-server remote read configs. Refer to Prometheus docs remote_read
for more details |
[] |
| server.remoteWrite |
Specifies prometheus-server remote write configs. Refer to Prometheus docs remote_write
for more details |
[] |
| server.replicaCount |
Specifies the replicaCount for prometheus-server deployment / statefulSet. Note: server.statefulSet.enabled should be set to true if server.replicaCount is greater than 1 |
1 |
| server.resources |
Specifies resource requests and limits of the prometheus-server container. Refer to the Kubernetes API documentation ResourceRequirements
field for more details |
{} |
| server.retention |
Specifies prometheus-server data retention period |
"15d" |
| server.service |
Specifies how to expose prometheus-server as a network service |
See footnote |
| server.statefulSet.enabled |
Indicates if prometheus-server is deployed as a statefulSet. If set to false, prometheus-server will be deployed as a deployment |
false |
| serverFiles.“prometheus.yml”.scrape_configs |
Specifies a set of targets and parameters for prometheus-server describing how to scrape them. Refer to Prometheus docs scrape_config
for more details |
See footnote |
| serviceAccounts.server.annotations |
Specifies prometheus-server service account annotations |
{} |
| serviceAccounts.server.create |
Indicates if prometheus-server service account will be created |
true |
| serviceAccounts.server.name |
Specifies prometheus-server service account name |
"" |
8 - v3.8.0
Configuring Prometheus in EKS Anywhere package spec
Example
apiVersion: packages.eks.amazonaws.com/v1alpha1
kind: Package
metadata:
  name: generated-prometheus
  namespace: eksa-packages-<cluster-name>
spec:
  packageName: prometheus
  targetNamespace: observability
  config: |
    server:
      replicaCount: 2
      statefulSet:
        enabled: true
Configurable parameters and default values under spec.config
| Parameter |
Description |
Default |
| General |
|
|
| rbac.create |
Specifies if clusterRole / role and clusterRoleBinding / roleBinding will be created for prometheus-server and node-exporter |
true |
| sourceRegistry |
Specifies image source registry for prometheus-server and node-exporter |
"783794618700.dkr.ecr.us-west-2.amazonaws.com" |
| Node-Exporter |
|
|
| nodeExporter.enabled |
Indicates if node-exporter is enabled |
true |
| nodeExporter.hostNetwork |
Indicates if node-exporter shares the host network namespace |
true |
| nodeExporter.hostPID |
Indicates if node-exporter shares the host process ID namespace |
true |
| nodeExporter.image.pullPolicy |
Specifies node-exporter image pull policy: IfNotPresent, Always, Never |
"IfNotPresent" |
| nodeExporter.image.repository |
Specifies node-exporter image repository |
"prometheus/node-exporter" |
| nodeExporter.resources |
Specifies resource requests and limits of the node-exporter container. Refer to the Kubernetes API documentation ResourceRequirements
field for more details |
{} |
| nodeExporter.service |
Specifies how to expose node-exporter as a network service |
See footnote |
| nodeExporter.tolerations |
Specifies node tolerations for node-exporter scheduling to nodes with taints. Refer to the Kubernetes API documentation toleration
field for more details. |
See footnote |
| serviceAccounts.nodeExporter.annotations |
Specifies node-exporter service account annotations |
{} |
| serviceAccounts.nodeExporter.create |
Indicates if node-exporter service account will be created |
true |
| serviceAccounts.nodeExporter.name |
Specifies node-exporter service account name |
"" |
| Prometheus-Server |
|
|
| server.enabled |
Indicates if prometheus-server is enabled |
true |
| server.global.evaluation_interval |
Specifies how frequently the prometheus-server rules are evaluated |
"1m" |
| server.global.scrape_interval |
Specifies how frequently prometheus-server will scrape targets |
"1m" |
| server.global.scrape_timeout |
Specifies how long until a prometheus-server scrape request times out |
"10s" |
| server.image.pullPolicy |
Specifies prometheus-server image pull policy: IfNotPresent, Always, Never |
"IfNotPresent" |
| server.image.repository |
Specifies prometheus-server image repository |
"prometheus/prometheus" |
| server.name |
Specifies prometheus-server container name |
"server" |
| server.persistentVolume.accessModes |
Specifies prometheus-server data Persistent Volume access modes |
"ReadWriteOnce" |
| server.persistentVolume.enabled |
Indicates if prometheus-server will create/use a Persistent Volume Claim |
true |
| server.persistentVolume.existingClaim |
Specifies prometheus-server data Persistent Volume existing claim name. It requires server.persistentVolume.enabled: true. If defined, PVC must be created manually before volume will be bound |
"" |
| server.persistentVolume.size |
Specifies prometheus-server data Persistent Volume size |
"8Gi" |
| server.remoteRead |
Specifies prometheus-server remote read configs. Refer to Prometheus docs remote_read
for more details |
[] |
| server.remoteWrite |
Specifies prometheus-server remote write configs. Refer to Prometheus docs remote_write
for more details |
[] |
| server.replicaCount |
Specifies the replicaCount for prometheus-server deployment / statefulSet. Note: server.statefulSet.enabled should be set to true if server.replicaCount is greater than 1 |
1 |
| server.resources |
Specifies resource requests and limits of the prometheus-server container. Refer to the Kubernetes API documentation ResourceRequirements
field for more details |
{} |
| server.retention |
Specifies prometheus-server data retention period |
"15d" |
| server.service |
Specifies how to expose prometheus-server as a network service |
See footnote |
| server.statefulSet.enabled |
Indicates if prometheus-server is deployed as a statefulSet. If set to false, prometheus-server will be deployed as a deployment |
false |
| serverFiles.“prometheus.yml”.scrape_configs |
Specifies a set of targets and parameters for prometheus-server describing how to scrape them. Refer to Prometheus docs scrape_config
for more details |
See footnote |
| serviceAccounts.server.annotations |
Specifies prometheus-server service account annotations |
{} |
| serviceAccounts.server.create |
Indicates if prometheus-server service account will be created |
true |
| serviceAccounts.server.name |
Specifies prometheus-server service account name |
"" |
