ADOT with AMP and AMG
This tutorial demonstrates how to config the ADOT package to scrape metrics from an EKS Anywhere cluster, and send them to Amazon Managed Service for Prometheus (AMP) and Amazon Managed Grafana (AMG).
This tutorial walks through the following procedures:
- Create an AMP workspace ;
- Setup IRSA for ADOT ;
- Install the ADOT package ;
- Create an AMG workspace and connect to the AMP workspace .
Note
- We included
Testsections below for critical steps to help users to validate they have completed such procedure properly. We recommend going through them in sequence as checkpoints of the progress. - We recommend creating all resources in the
us-west-2region.
Create an AMP workspace
An AMP workspace is created to receive metrics from the ADOT package, and respond to query requests from AMG. Follow steps below to complete the set up:
-
Open the AMP console at https://console.aws.amazon.com/prometheus/.
-
Choose region
us-west-2from the top right corner. -
Click on
Createto create a workspace. -
Type a workspace alias (
adot-amp-testas an example), and click onCreate workspace.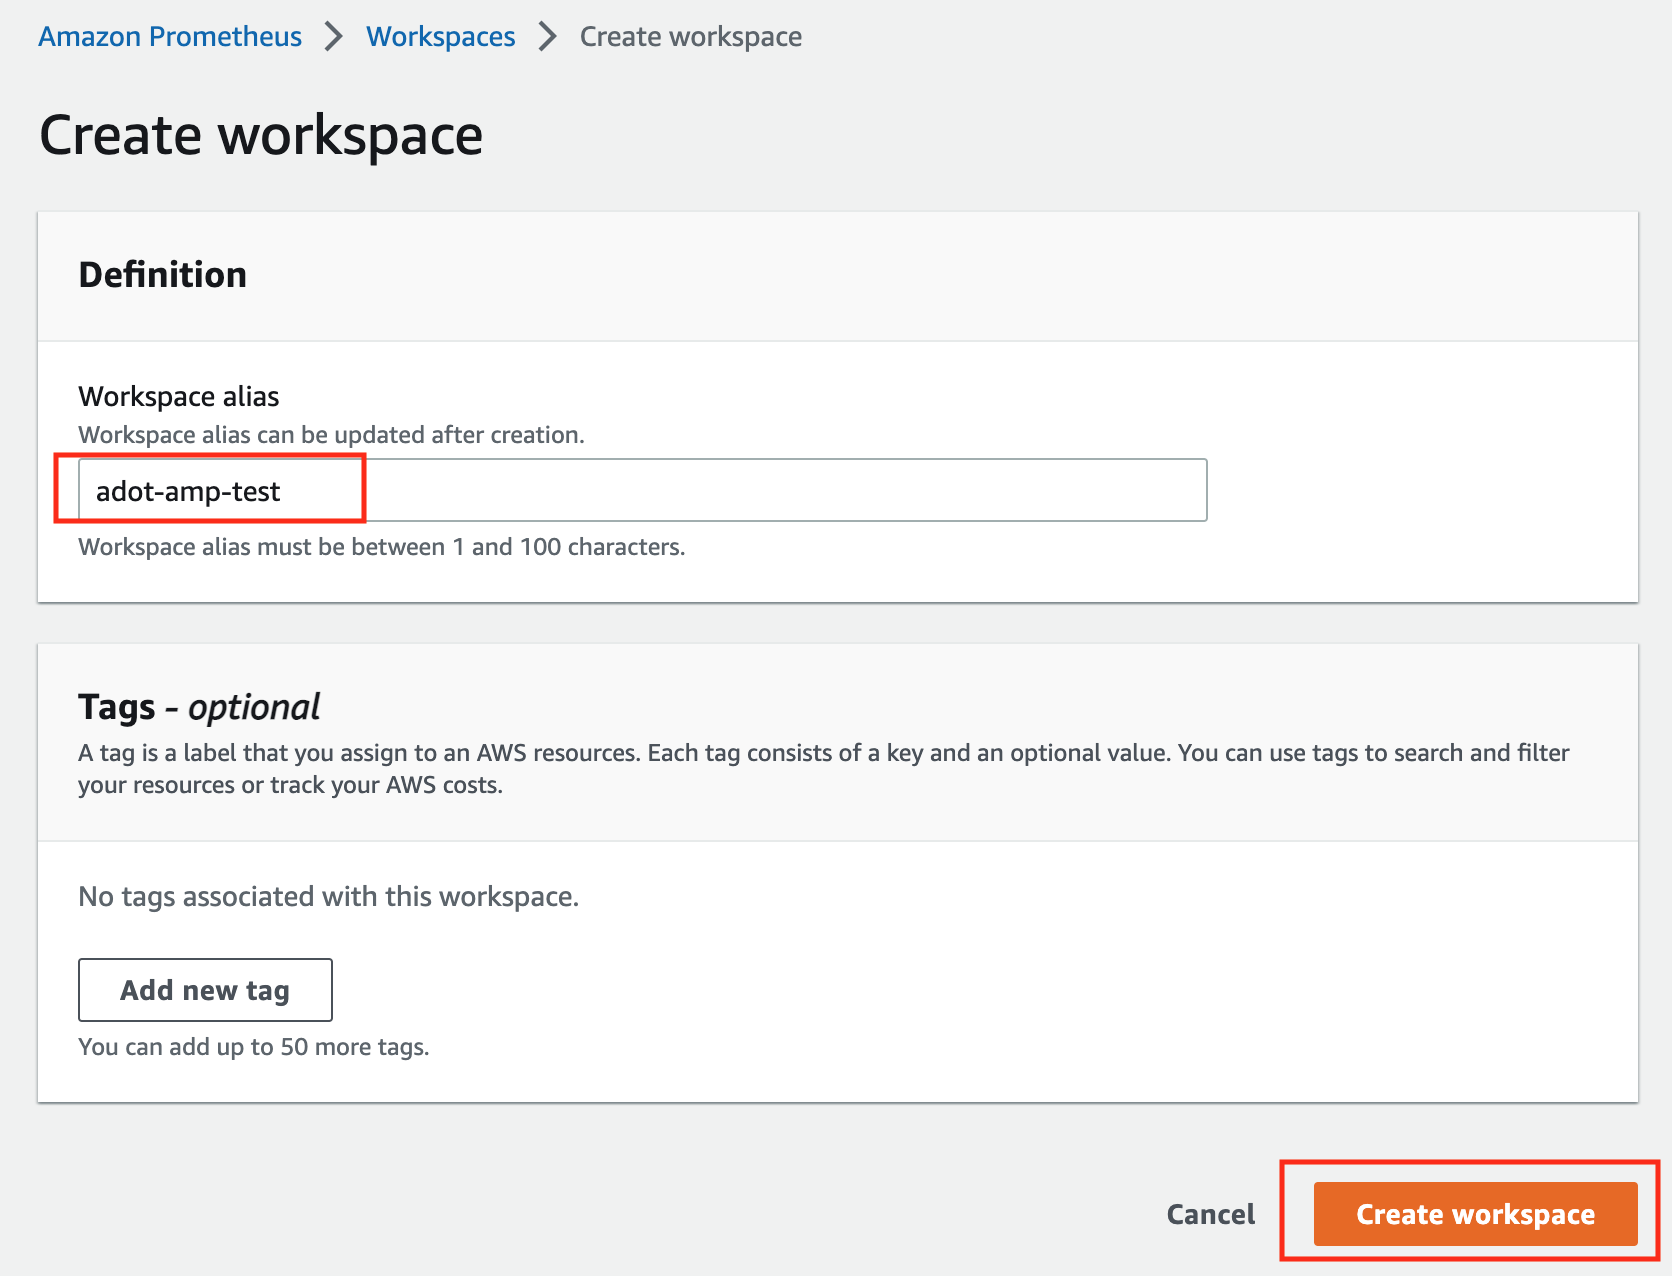
-
Make notes of the URLs displayed for
Endpoint - remote write URLandEndpoint - query URL. You’ll need them when you configure your ADOT package to remote write metrics to this workspace and when you query metrics from this workspace. Make sure the workspace’sStatusshowsActivebefore proceeding to the next step.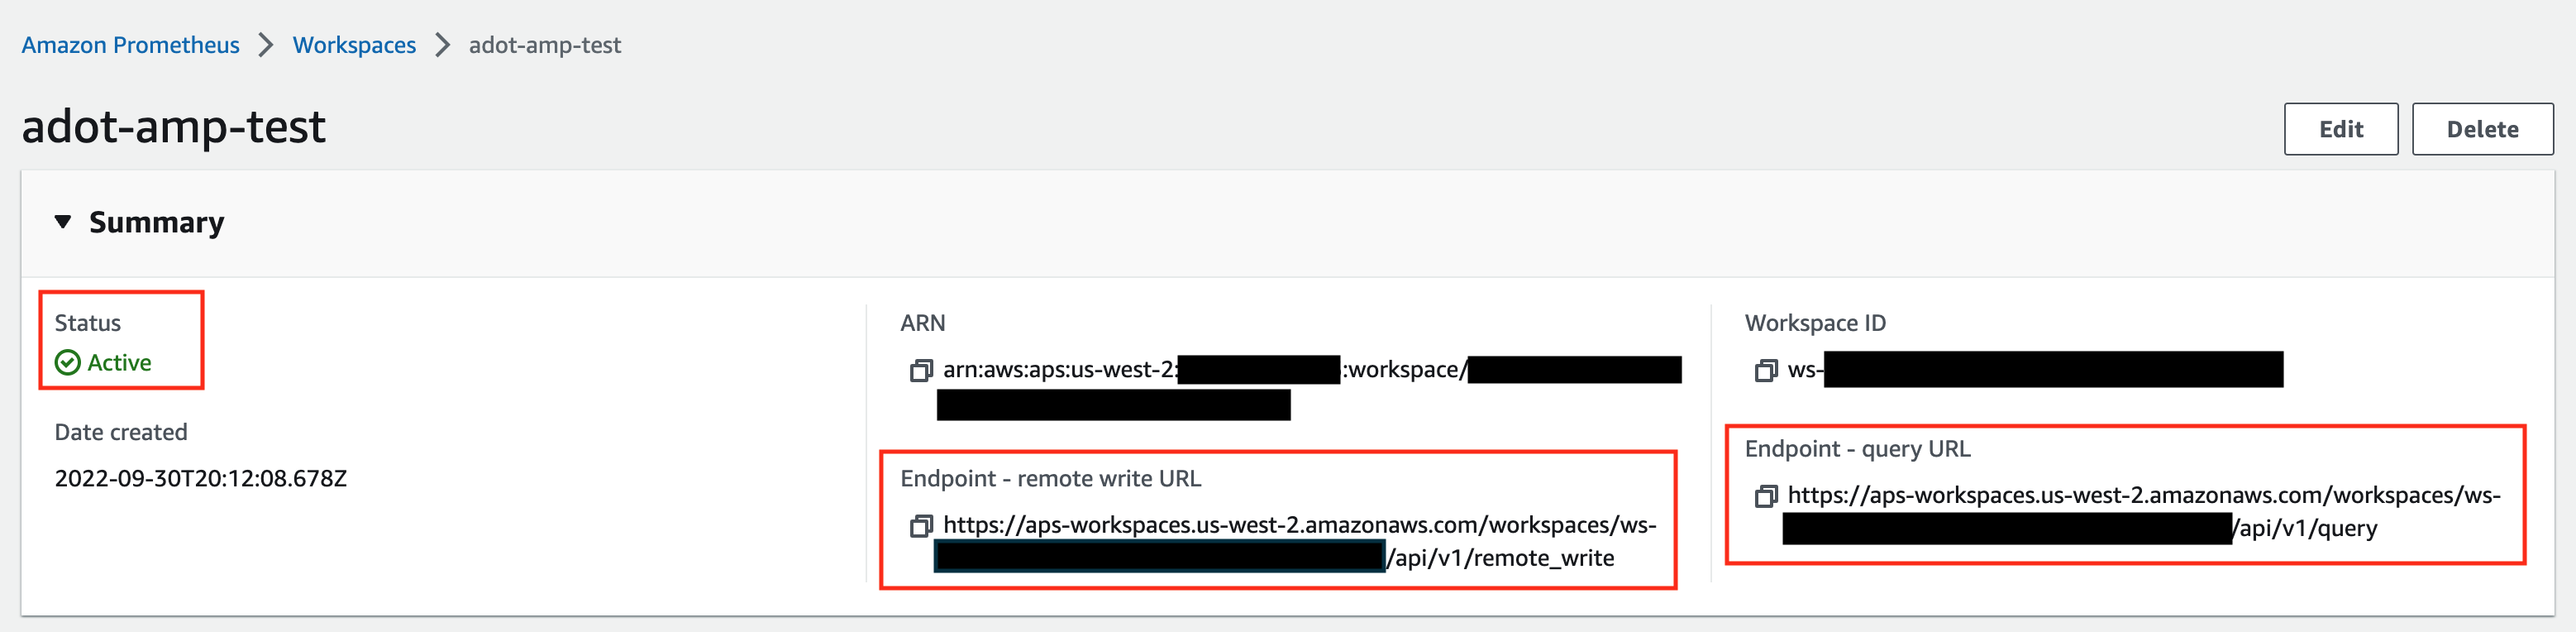
For additional options (i.e. through CLI) and configurations (i.e. add a tag) to create an AMP workspace, refer to AWS AMP create a workspace guide.
Setup IRSA for ADOT
If you haven’t already configured IRSA for your cluster, follow the EKS Anywhere cluster spec for Pod IAM guide. This one-time setup includes creating an OIDC provider, configuring your cluster, generating keys, and deploying the pod-identity-webhook.
After IRSA infrastructure is configured, create an IAM role for ADOT. Replace <ACCOUNT_ID>, <ISSUER_HOSTPATH> with your values:
-
Create an IAM role with a trust policy that allows the ADOT ServiceAccount to assume it:
{ "Version": "2012-10-17", "Statement": [ { "Effect": "Allow", "Principal": { "Federated": "arn:aws:iam::<ACCOUNT_ID>:oidc-provider/<ISSUER_HOSTPATH>" }, "Action": "sts:AssumeRoleWithWebIdentity", "Condition": { "StringEquals": { "<ISSUER_HOSTPATH>:sub": "system:serviceaccount:observability:adot-collector", "<ISSUER_HOSTPATH>:aud": "sts.amazonaws.com" } } } ] } -
Attach an IAM policy with proper AMP access to the IAM role. Below is an example that gives full access to AMP actions and resources. Refer to AMP IAM permissions and policies guide for more customized options.
{ "Version": "2012-10-17", "Statement": [ { "Action": [ "aps:*" ], "Effect": "Allow", "Resource": "*" } ] } -
Save the IAM role ARN (e.g.,
arn:aws:iam::123456789012:role/adot-amp-role). You’ll use this in the ADOT package configuration below.
Install the ADOT package
The ADOT package will be configured with three main components:
-
Prometheus Receiver: Designed to be a drop-in replacement for a Prometheus Server, capable of scraping metrics from microservices instrumented with the Prometheus client library
-
Prometheus Remote Write Exporter: Sends metrics to AMP for long-term storage using the remote write protocol
-
Sigv4 Authentication Extension: Enables ADOT pods to authenticate to AWS services using the IAM role configured via IRSA
The ADOT package can be configured using presets for automatic collector and RBAC setup, explicit rules and config, or both combined.
Using Presets
This approach uses the ADOT helm chart’s preset feature to automatically configure collectors and RBAC permissions.
-
Create an ADOT package configuration file named
adot-package.yaml. Review comments carefully and replace everything wrapped with<>tags.Click to expand ADOT package config with presets
apiVersion: packages.eks.amazonaws.com/v1alpha1 kind: Package metadata: name: my-adot namespace: eksa-packages spec: packageName: adot targetNamespace: observability config: | mode: deployment serviceAccount: create: true annotations: eks.amazonaws.com/role-arn: "<IAM-ROLE-ARN>" name: "adot-collector" presets: kubernetesAttributes: enabled: true kubeletMetrics: enabled: true clusterRole: create: true config: extensions: sigv4auth: region: "us-west-2" service: "aps" assume_role: sts_region: "us-west-2" receivers: prometheus: config: global: scrape_interval: 15s scrape_timeout: 10s scrape_configs: - job_name: kubernetes-apiservers bearer_token_file: /var/run/secrets/kubernetes.io/serviceaccount/token kubernetes_sd_configs: - role: endpoints relabel_configs: - action: keep regex: default;kubernetes;https source_labels: - __meta_kubernetes_namespace - __meta_kubernetes_service_name - __meta_kubernetes_endpoint_port_name scheme: https tls_config: ca_file: /var/run/secrets/kubernetes.io/serviceaccount/ca.crt insecure_skip_verify: false - job_name: kubernetes-nodes bearer_token_file: /var/run/secrets/kubernetes.io/serviceaccount/token kubernetes_sd_configs: - role: node relabel_configs: - action: labelmap regex: __meta_kubernetes_node_label_(.+) - replacement: kubernetes.default.svc:443 target_label: __address__ - regex: (.+) replacement: /api/v1/nodes/$$1/proxy/metrics source_labels: - __meta_kubernetes_node_name target_label: __metrics_path__ scheme: https tls_config: ca_file: /var/run/secrets/kubernetes.io/serviceaccount/ca.crt insecure_skip_verify: false - job_name: kubernetes-service-endpoints kubernetes_sd_configs: - role: endpoints relabel_configs: - action: keep regex: true source_labels: - __meta_kubernetes_service_annotation_prometheus_io_scrape - action: replace regex: (https?) source_labels: - __meta_kubernetes_service_annotation_prometheus_io_scheme target_label: __scheme__ - action: replace regex: (.+) source_labels: - __meta_kubernetes_service_annotation_prometheus_io_path target_label: __metrics_path__ - action: replace regex: ([^:]+)(?::\d+)?;(\d+) replacement: $$1:$$2 source_labels: - __address__ - __meta_kubernetes_service_annotation_prometheus_io_port target_label: __address__ - action: labelmap regex: __meta_kubernetes_service_label_(.+) - action: replace source_labels: - __meta_kubernetes_namespace target_label: kubernetes_namespace - action: replace source_labels: - __meta_kubernetes_service_name target_label: kubernetes_name processors: batch/metrics: timeout: 60s exporters: debug: verbosity: detailed prometheusremotewrite: endpoint: "<AMP-WORKSPACE-ENDPOINT>/api/v1/remote_write" # Replace with your AMP workspace remote write endpoint auth: authenticator: sigv4auth service: extensions: - health_check - sigv4auth pipelines: metrics: receivers: [prometheus] processors: [batch/metrics] exporters: [debug, prometheusremotewrite] -
Install the ADOT package using the configuration file:
eksctl anywhere create packages -f adot-package.yaml
Using Explicit RBAC Rules
For custom configurations, you can explicitly define ClusterRole rules in your package configuration.
-
Create an ADOT package configuration file named
adot-package.yamlwith explicit RBAC rules. Review comments carefully and replace everything wrapped with<>tags.Click to expand ADOT package config with explicit rules
apiVersion: packages.eks.amazonaws.com/v1alpha1 kind: Package metadata: name: my-adot namespace: eksa-packages spec: packageName: adot targetNamespace: observability config: | mode: deployment serviceAccount: create: true annotations: eks.amazonaws.com/role-arn: "<IAM-ROLE-ARN>" name: "adot-collector" clusterRole: create: true rules: - apiGroups: [""] resources: - nodes - nodes/proxy - services - endpoints - pods verbs: ["get", "list", "watch"] - apiGroups: ["extensions"] resources: - ingresses verbs: ["get", "list", "watch"] - apiGroups: ["discovery.k8s.io"] resources: - endpointslices verbs: ["get", "list", "watch"] - nonResourceURLs: - /metrics verbs: ["get"] config: extensions: sigv4auth: region: "us-west-2" service: "aps" assume_role: sts_region: "us-west-2" receivers: prometheus: config: global: scrape_interval: 15s scrape_timeout: 10s scrape_configs: - job_name: kubernetes-apiservers bearer_token_file: /var/run/secrets/kubernetes.io/serviceaccount/token kubernetes_sd_configs: - role: endpoints relabel_configs: - action: keep regex: default;kubernetes;https source_labels: - __meta_kubernetes_namespace - __meta_kubernetes_service_name - __meta_kubernetes_endpoint_port_name scheme: https tls_config: ca_file: /var/run/secrets/kubernetes.io/serviceaccount/ca.crt insecure_skip_verify: false - job_name: kubernetes-nodes bearer_token_file: /var/run/secrets/kubernetes.io/serviceaccount/token kubernetes_sd_configs: - role: node relabel_configs: - action: labelmap regex: __meta_kubernetes_node_label_(.+) - replacement: kubernetes.default.svc:443 target_label: __address__ - regex: (.+) replacement: /api/v1/nodes/$$1/proxy/metrics source_labels: - __meta_kubernetes_node_name target_label: __metrics_path__ scheme: https tls_config: ca_file: /var/run/secrets/kubernetes.io/serviceaccount/ca.crt insecure_skip_verify: false - job_name: kubernetes-nodes-cadvisor bearer_token_file: /var/run/secrets/kubernetes.io/serviceaccount/token kubernetes_sd_configs: - role: node relabel_configs: - action: labelmap regex: __meta_kubernetes_node_label_(.+) - replacement: kubernetes.default.svc:443 target_label: __address__ - regex: (.+) replacement: /api/v1/nodes/$$1/proxy/metrics/cadvisor source_labels: - __meta_kubernetes_node_name target_label: __metrics_path__ scheme: https tls_config: ca_file: /var/run/secrets/kubernetes.io/serviceaccount/ca.crt insecure_skip_verify: false - job_name: kubernetes-service-endpoints kubernetes_sd_configs: - role: endpoints relabel_configs: - action: keep regex: true source_labels: - __meta_kubernetes_service_annotation_prometheus_io_scrape - action: replace regex: (https?) source_labels: - __meta_kubernetes_service_annotation_prometheus_io_scheme target_label: __scheme__ - action: replace regex: (.+) source_labels: - __meta_kubernetes_service_annotation_prometheus_io_path target_label: __metrics_path__ - action: replace regex: ([^:]+)(?::\d+)?;(\d+) replacement: $$1:$$2 source_labels: - __address__ - __meta_kubernetes_service_annotation_prometheus_io_port target_label: __address__ - action: labelmap regex: __meta_kubernetes_service_annotation_prometheus_io_param_(.+) replacement: __param_$$1 - action: labelmap regex: __meta_kubernetes_service_label_(.+) - action: replace source_labels: - __meta_kubernetes_namespace target_label: kubernetes_namespace - action: replace source_labels: - __meta_kubernetes_service_name target_label: kubernetes_name - action: replace source_labels: - __meta_kubernetes_pod_node_name target_label: kubernetes_node - job_name: kubernetes-service-endpoints-slow kubernetes_sd_configs: - role: endpoints relabel_configs: - action: keep regex: true source_labels: - __meta_kubernetes_service_annotation_prometheus_io_scrape_slow - action: replace regex: (https?) source_labels: - __meta_kubernetes_service_annotation_prometheus_io_scheme target_label: __scheme__ - action: replace regex: (.+) source_labels: - __meta_kubernetes_service_annotation_prometheus_io_path target_label: __metrics_path__ - action: replace regex: ([^:]+)(?::\d+)?;(\d+) replacement: $$1:$$2 source_labels: - __address__ - __meta_kubernetes_service_annotation_prometheus_io_port target_label: __address__ - action: labelmap regex: __meta_kubernetes_service_annotation_prometheus_io_param_(.+) replacement: __param_$$1 - action: labelmap regex: __meta_kubernetes_service_label_(.+) - action: replace source_labels: - __meta_kubernetes_namespace target_label: kubernetes_namespace - action: replace source_labels: - __meta_kubernetes_service_name target_label: kubernetes_name - action: replace source_labels: - __meta_kubernetes_pod_node_name target_label: kubernetes_node scrape_interval: 5m scrape_timeout: 30s - job_name: prometheus-pushgateway kubernetes_sd_configs: - role: service relabel_configs: - action: keep regex: pushgateway source_labels: - __meta_kubernetes_service_annotation_prometheus_io_probe - job_name: kubernetes-services kubernetes_sd_configs: - role: service metrics_path: /probe params: module: - http_2xx relabel_configs: - action: keep regex: true source_labels: - __meta_kubernetes_service_annotation_prometheus_io_probe - source_labels: - __address__ target_label: __param_target - replacement: blackbox target_label: __address__ - source_labels: - __param_target target_label: instance - action: labelmap regex: __meta_kubernetes_service_label_(.+) - source_labels: - __meta_kubernetes_namespace target_label: kubernetes_namespace - source_labels: - __meta_kubernetes_service_name target_label: kubernetes_name - job_name: kubernetes-pods kubernetes_sd_configs: - role: pod relabel_configs: - action: keep regex: true source_labels: - __meta_kubernetes_pod_annotation_prometheus_io_scrape - action: replace regex: (https?) source_labels: - __meta_kubernetes_pod_annotation_prometheus_io_scheme target_label: __scheme__ - action: replace regex: (.+) source_labels: - __meta_kubernetes_pod_annotation_prometheus_io_path target_label: __metrics_path__ - action: replace regex: ([^:]+)(?::\d+)?;(\d+) replacement: $$1:$$2 source_labels: - __address__ - __meta_kubernetes_pod_annotation_prometheus_io_port target_label: __address__ - action: labelmap regex: __meta_kubernetes_pod_annotation_prometheus_io_param_(.+) replacement: __param_$$1 - action: labelmap regex: __meta_kubernetes_pod_label_(.+) - action: replace source_labels: - __meta_kubernetes_namespace target_label: kubernetes_namespace - action: replace source_labels: - __meta_kubernetes_pod_name target_label: kubernetes_pod_name - action: drop regex: Pending|Succeeded|Failed|Completed source_labels: - __meta_kubernetes_pod_phase - job_name: kubernetes-pods-slow scrape_interval: 5m scrape_timeout: 30s kubernetes_sd_configs: - role: pod relabel_configs: - action: keep regex: true source_labels: - __meta_kubernetes_pod_annotation_prometheus_io_scrape_slow - action: replace regex: (https?) source_labels: - __meta_kubernetes_pod_annotation_prometheus_io_scheme target_label: __scheme__ - action: replace regex: (.+) source_labels: - __meta_kubernetes_pod_annotation_prometheus_io_path target_label: __metrics_path__ - action: replace regex: ([^:]+)(?::\d+)?;(\d+) replacement: $$1:$$2 source_labels: - __address__ - __meta_kubernetes_pod_annotation_prometheus_io_port target_label: __address__ - action: labelmap regex: __meta_kubernetes_pod_annotation_prometheus_io_param_(.+) replacement: __param_$1 - action: labelmap regex: __meta_kubernetes_pod_label_(.+) - action: replace source_labels: - __meta_kubernetes_namespace target_label: namespace - action: replace source_labels: - __meta_kubernetes_pod_name target_label: pod - action: drop regex: Pending|Succeeded|Failed|Completed source_labels: - __meta_kubernetes_pod_phase processors: batch/metrics: timeout: 60s exporters: debug: verbosity: detailed prometheusremotewrite: endpoint: "<AMP-WORKSPACE-ENDPOINT>/api/v1/remote_write" # Replace with your AMP workspace remote write endpoint auth: authenticator: sigv4auth service: extensions: - health_check - sigv4auth pipelines: metrics: receivers: [prometheus] processors: [batch/metrics] exporters: [debug, prometheusremotewrite] -
Install the ADOT package:
eksctl anywhere create packages -f adot-package.yaml
Available Presets
The ADOT helm chart provides several presets that automatically configure both collector features and RBAC permissions:
| Preset | Description | Auto-Added RBAC Rules |
|---|---|---|
kubernetesAttributes |
Adds Kubernetes metadata (pod, namespace, etc.) to metrics | pods, namespaces, replicasets (apps & extensions) |
kubeletMetrics |
Collects metrics from kubelet | nodes/stats |
clusterMetrics |
Collects cluster-level metrics | events, namespaces, nodes, pods, services, daemonsets, deployments, replicasets, statefulsets, jobs, cronjobs, horizontalpodautoscalers |
kubernetesEvents |
Collects Kubernetes events | events (events.k8s.io apiGroup) |
logsCollection |
Collects logs from nodes (best with daemonset mode) | None (requires host access) |
hostMetrics |
Collects host-level metrics (best with daemonset mode) | None (requires host access) |
For more details on presets, refer to the OpenTelemetry Collector Kubernetes Components documentation .
ADOT Package Test
To ensure the ADOT package is installed correctly in the cluster, perform the following tests:
Check pod logs
Check ADOT pod logs using kubectl logs <adot-pod-name> -n <namespace>. It should display logs similar to below.
...
2022-09-30T23:22:59.184Z	info	service/telemetry.go:103	Setting up own telemetry...
2022-09-30T23:22:59.184Z	info	service/telemetry.go:138	Serving Prometheus metrics	{"address": "0.0.0.0:8888", "level": "basic"}
2022-09-30T23:22:59.185Z	info	components/components.go:30	In development component. May change in the future.	{"kind": "exporter", "data_type": "metrics", "name": "logging", "stability": "in development"}
2022-09-30T23:22:59.186Z	info	extensions/extensions.go:42	Starting extensions...
2022-09-30T23:22:59.186Z	info	extensions/extensions.go:45	Extension is starting...	{"kind": "extension", "name": "health_check"}
2022-09-30T23:22:59.186Z	info	healthcheckextension@v0.58.0/healthcheckextension.go:44	Starting health_check extension	{"kind": "extension", "name": "health_check", "config": {"Endpoint":"0.0.0.0:13133","TLSSetting":null,"CORS":null,"Auth":null,"MaxRequestBodySize":0,"IncludeMetadata":false,"Path":"/","CheckCollectorPipeline":{"Enabled":false,"Interval":"5m","ExporterFailureThreshold":5}}}
2022-09-30T23:22:59.186Z	info	extensions/extensions.go:49	Extension started.	{"kind": "extension", "name": "health_check"}
2022-09-30T23:22:59.186Z	info	extensions/extensions.go:45	Extension is starting...	{"kind": "extension", "name": "memory_ballast"}
2022-09-30T23:22:59.187Z	info	ballastextension/memory_ballast.go:52	Setting memory ballast	{"kind": "extension", "name": "memory_ballast", "MiBs": 0}
2022-09-30T23:22:59.187Z	info	extensions/extensions.go:49	Extension started.	{"kind": "extension", "name": "memory_ballast"}
2022-09-30T23:22:59.187Z	info	extensions/extensions.go:45	Extension is starting...	{"kind": "extension", "name": "sigv4auth"}
2022-09-30T23:22:59.187Z	info	extensions/extensions.go:49	Extension started.	{"kind": "extension", "name": "sigv4auth"}
2022-09-30T23:22:59.187Z	info	pipelines/pipelines.go:74	Starting exporters...
2022-09-30T23:22:59.187Z	info	pipelines/pipelines.go:78	Exporter is starting...	{"kind": "exporter", "data_type": "metrics", "name": "logging"}
2022-09-30T23:22:59.187Z	info	pipelines/pipelines.go:82	Exporter started.	{"kind": "exporter", "data_type": "metrics", "name": "logging"}
2022-09-30T23:22:59.187Z	info	pipelines/pipelines.go:78	Exporter is starting...	{"kind": "exporter", "data_type": "metrics", "name": "prometheusremotewrite"}
2022-09-30T23:22:59.187Z	info	pipelines/pipelines.go:82	Exporter started.	{"kind": "exporter", "data_type": "metrics", "name": "prometheusremotewrite"}
2022-09-30T23:22:59.187Z	info	pipelines/pipelines.go:86	Starting processors...
2022-09-30T23:22:59.187Z	info	pipelines/pipelines.go:90	Processor is starting...	{"kind": "processor", "name": "batch/metrics", "pipeline": "metrics"}
2022-09-30T23:22:59.187Z	info	pipelines/pipelines.go:94	Processor started.	{"kind": "processor", "name": "batch/metrics", "pipeline": "metrics"}
2022-09-30T23:22:59.187Z	info	pipelines/pipelines.go:98	Starting receivers...
2022-09-30T23:22:59.187Z	info	pipelines/pipelines.go:102	Receiver is starting...	{"kind": "receiver", "name": "prometheus", "pipeline": "metrics"}
2022-09-30T23:22:59.187Z	info	kubernetes/kubernetes.go:326	Using pod service account via in-cluster config	{"kind": "receiver", "name": "prometheus", "pipeline": "metrics", "discovery": "kubernetes"}
2022-09-30T23:22:59.188Z	info	kubernetes/kubernetes.go:326	Using pod service account via in-cluster config	{"kind": "receiver", "name": "prometheus", "pipeline": "metrics", "discovery": "kubernetes"}
2022-09-30T23:22:59.188Z	info	kubernetes/kubernetes.go:326	Using pod service account via in-cluster config	{"kind": "receiver", "name": "prometheus", "pipeline": "metrics", "discovery": "kubernetes"}
2022-09-30T23:22:59.188Z	info	kubernetes/kubernetes.go:326	Using pod service account via in-cluster config	{"kind": "receiver", "name": "prometheus", "pipeline": "metrics", "discovery": "kubernetes"}
2022-09-30T23:22:59.189Z	info	pipelines/pipelines.go:106	Receiver started.	{"kind": "receiver", "name": "prometheus", "pipeline": "metrics"}
2022-09-30T23:22:59.189Z	info	healthcheck/handler.go:129	Health Check state change	{"kind": "extension", "name": "health_check", "status": "ready"}
2022-09-30T23:22:59.189Z	info	service/collector.go:215	Starting aws-otel-collector...	{"Version": "v0.21.1", "NumCPU": 2}
2022-09-30T23:22:59.189Z	info	service/collector.go:128	Everything is ready. Begin running and processing data.
...
Check AMP endpoint using awscurl
Use awscurl commands below to check if AMP received the metrics data sent by ADOT. The awscurl tool is a curl like tool with AWS Signature Version 4 request signing. The command below should return a status code success.
pip install awscurl
awscurl -X POST --region us-west-2 --service aps "<amp-query-endpoint>?query=up"
Create an AMG workspace and connect to the AMP workspace
An AMG workspace is created to query metrics from the AMP workspace and visualize the metrics in user-selected or user-built dashboards.
Follow steps below to create the AMG workspace:
-
Enable AWS Single-Sign-on (AWS SSO). Refer to IAM Identity Center for details.
-
Open the Amazon Managed Grafana console at https://console.aws.amazon.com/grafana/.
-
Choose
Create workspace. -
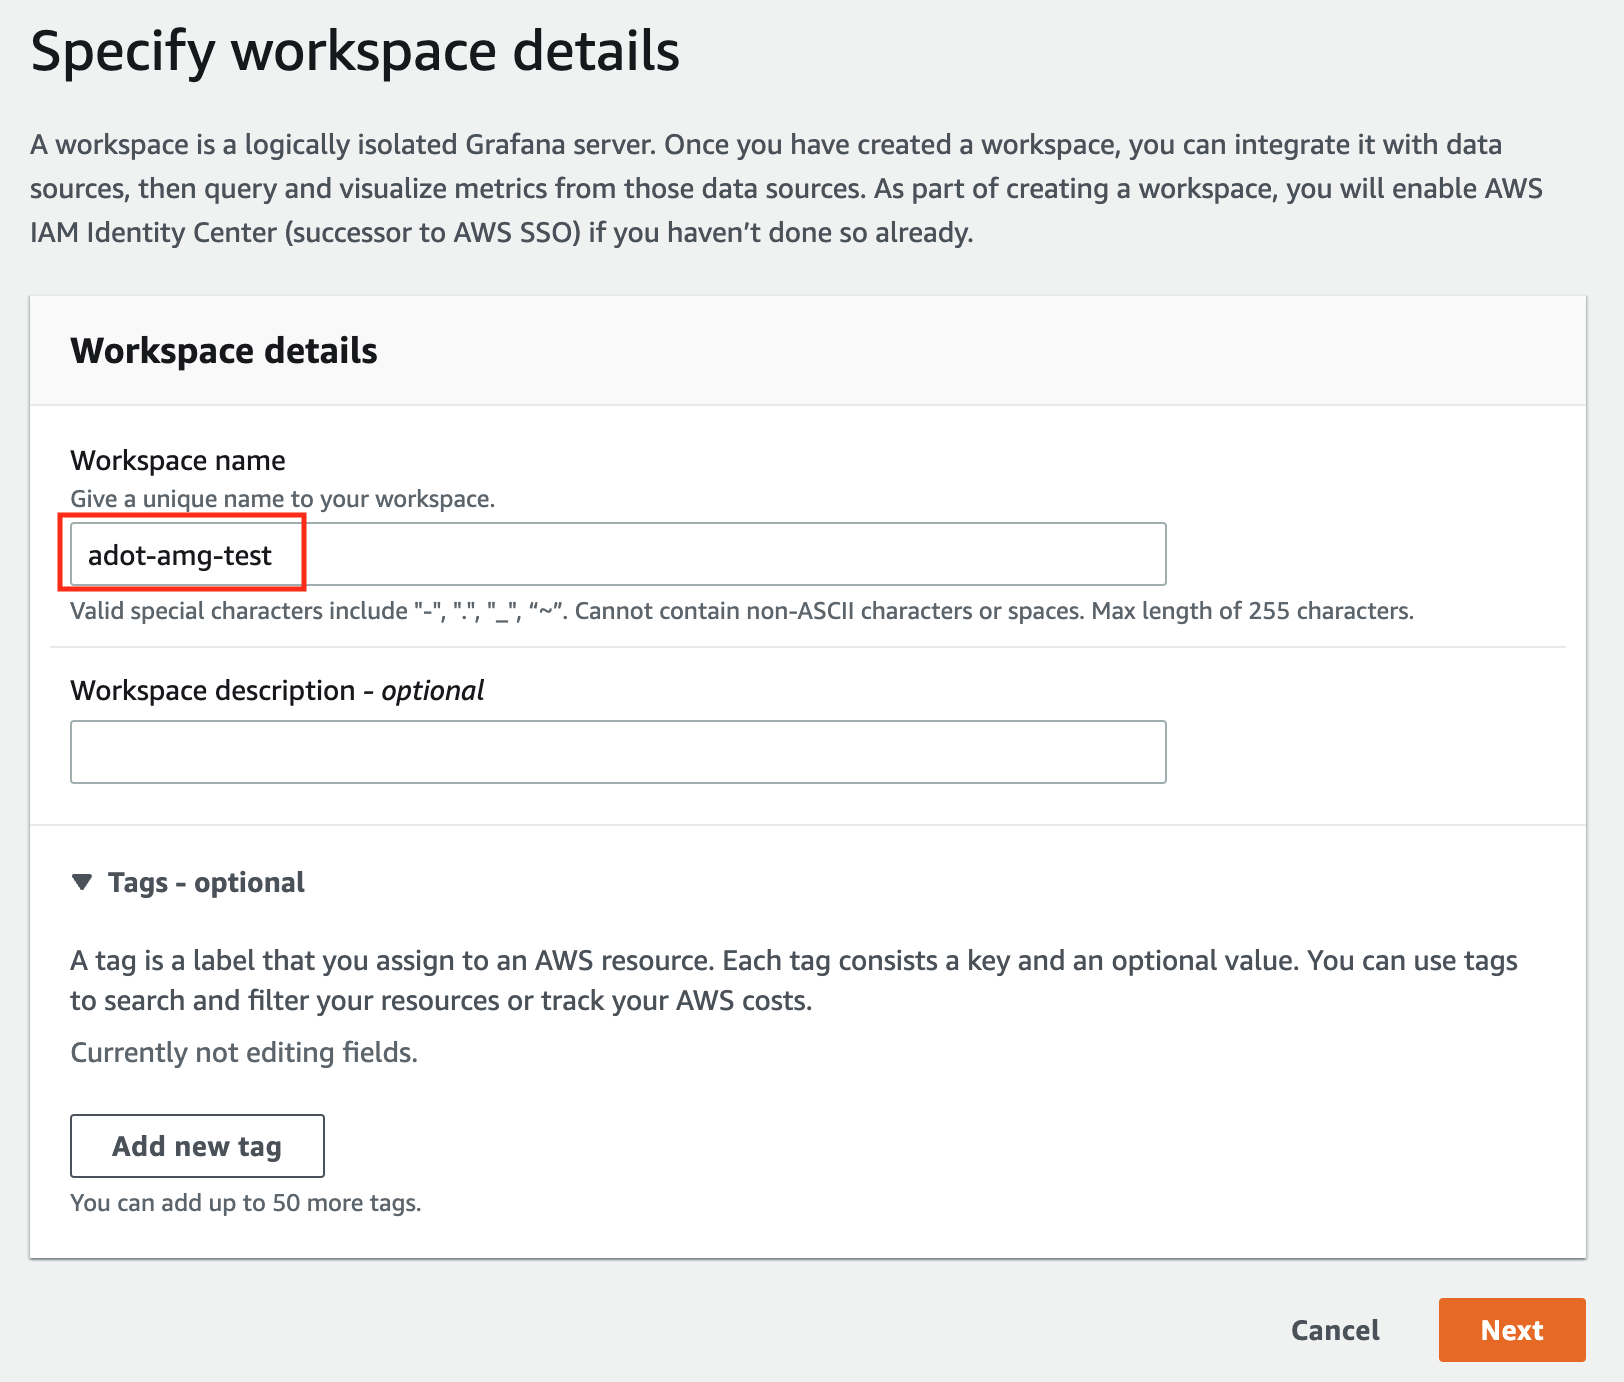
In the Workspace details window, for Workspace name, enter a name for the workspace.
-
In the config settings window, choose
Authentication accessbyAWS IAM Identity Center, andPermission typeofService managed.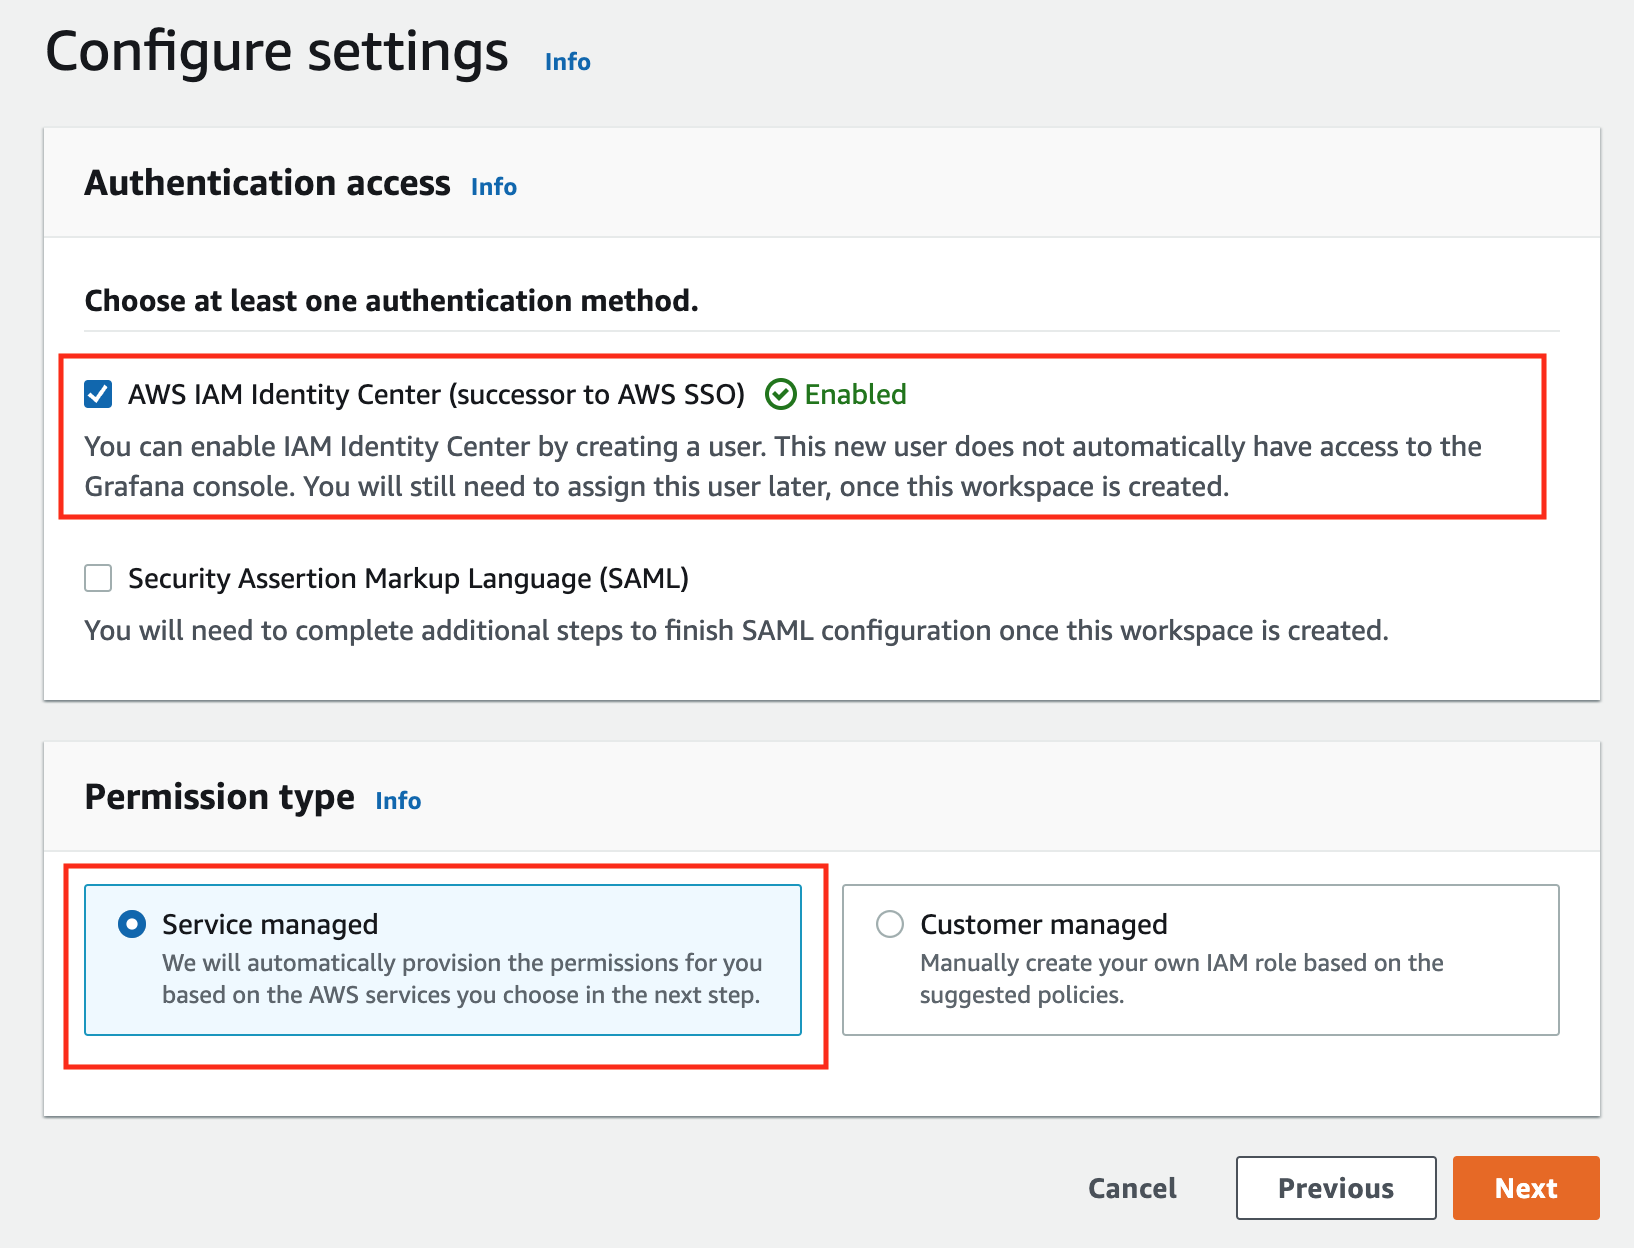
-
In the IAM permission access setting window, choose
Current accountaccess, andAmazon Managed Service for Prometheusas data source.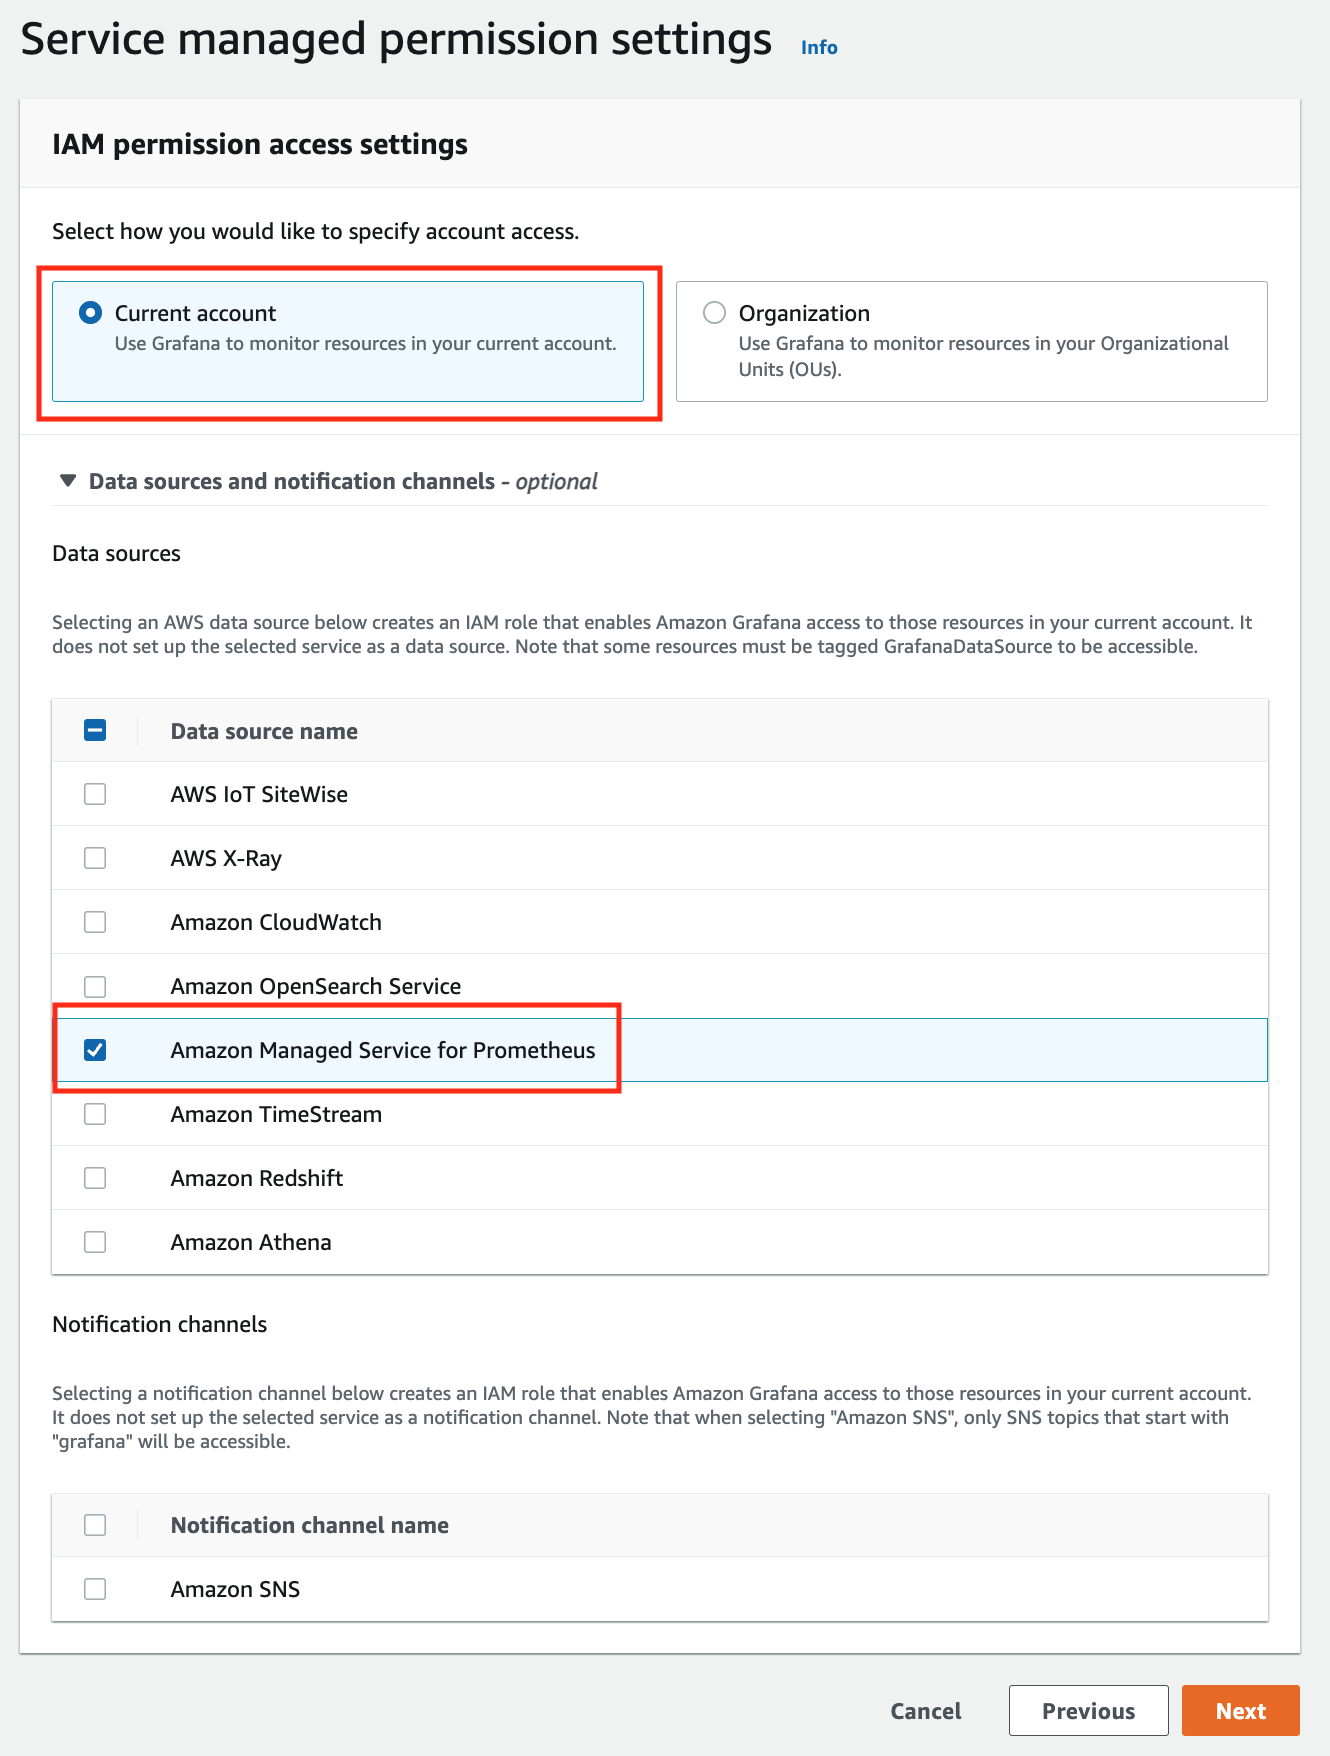
-
Review all settings and click on
Create workspace.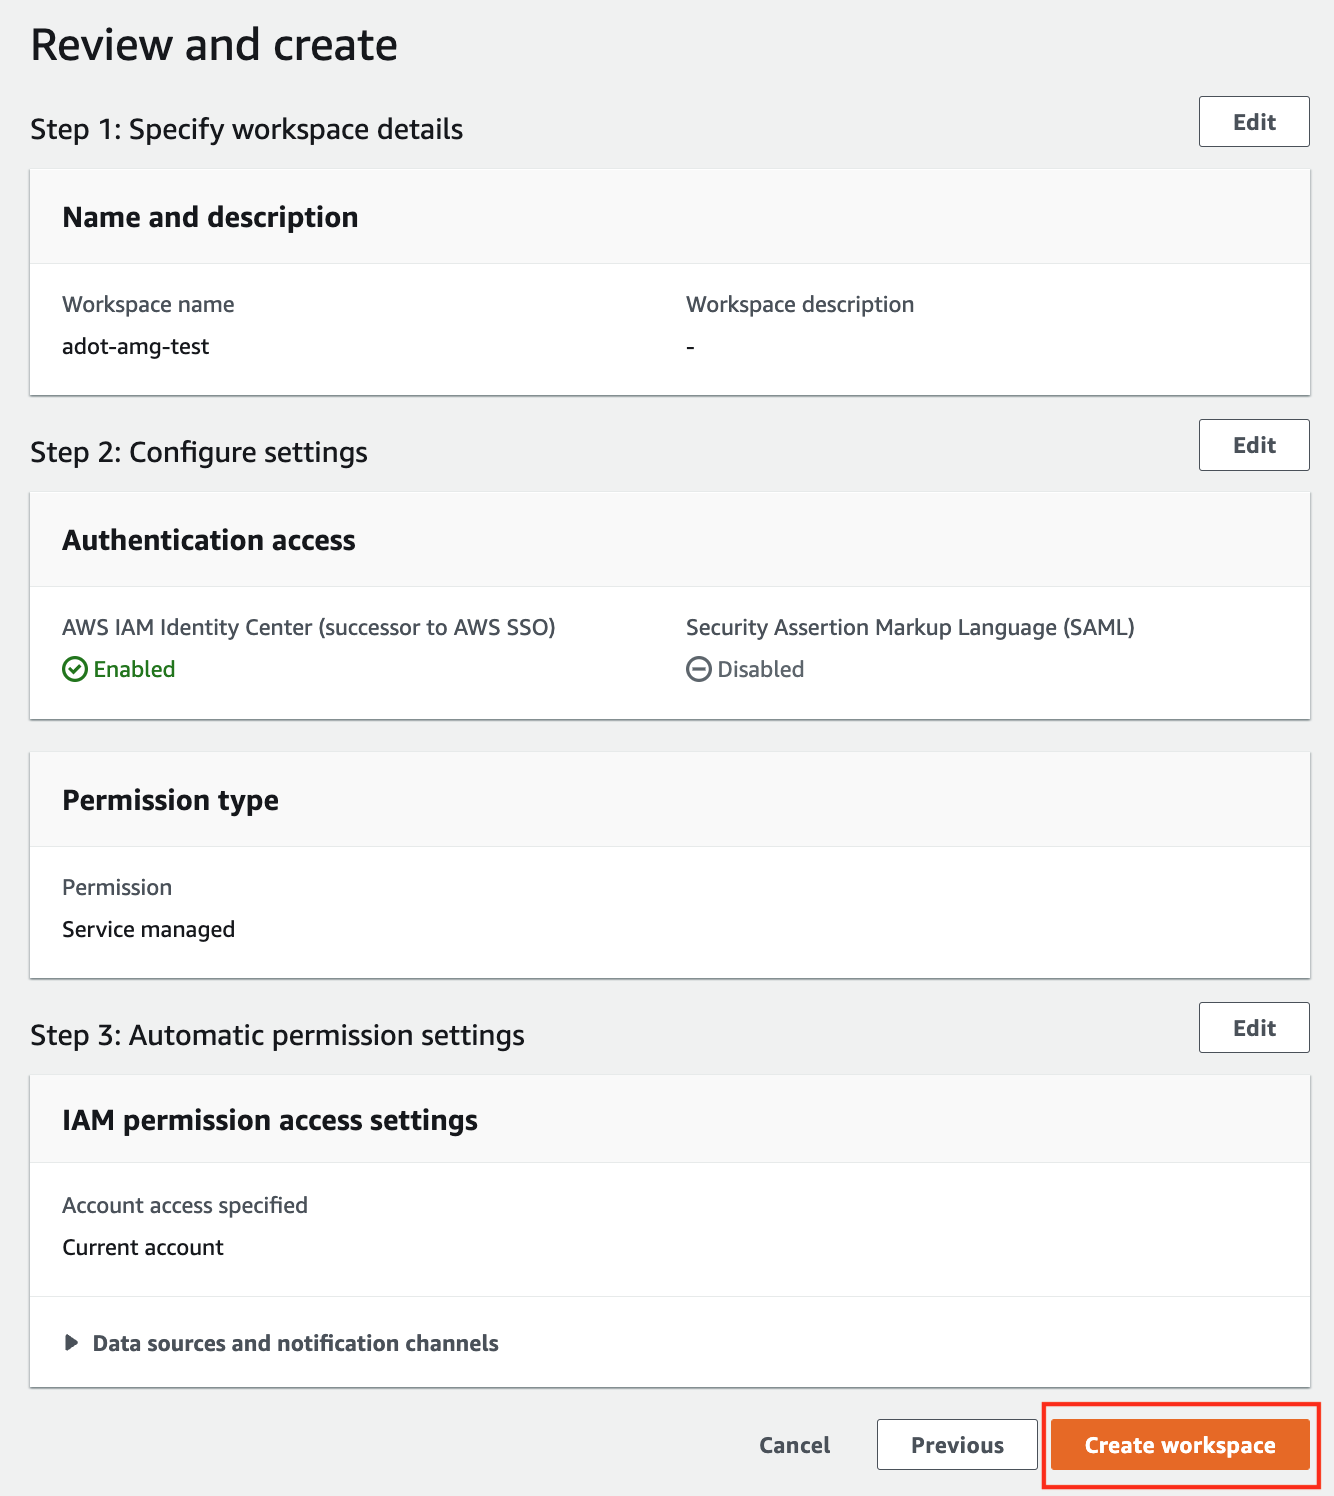
-
Once the workspace shows a
StatusofActive, you can access it by clicking theGrafana workspace URL. Click onSign in with AWS IAM Identity Centerto finish the authentication.
Follow steps below to add the AMP workspace to AMG:
-
Click on the
configsign on the left navigation bar, selectData sources, then choosePrometheusas theData source.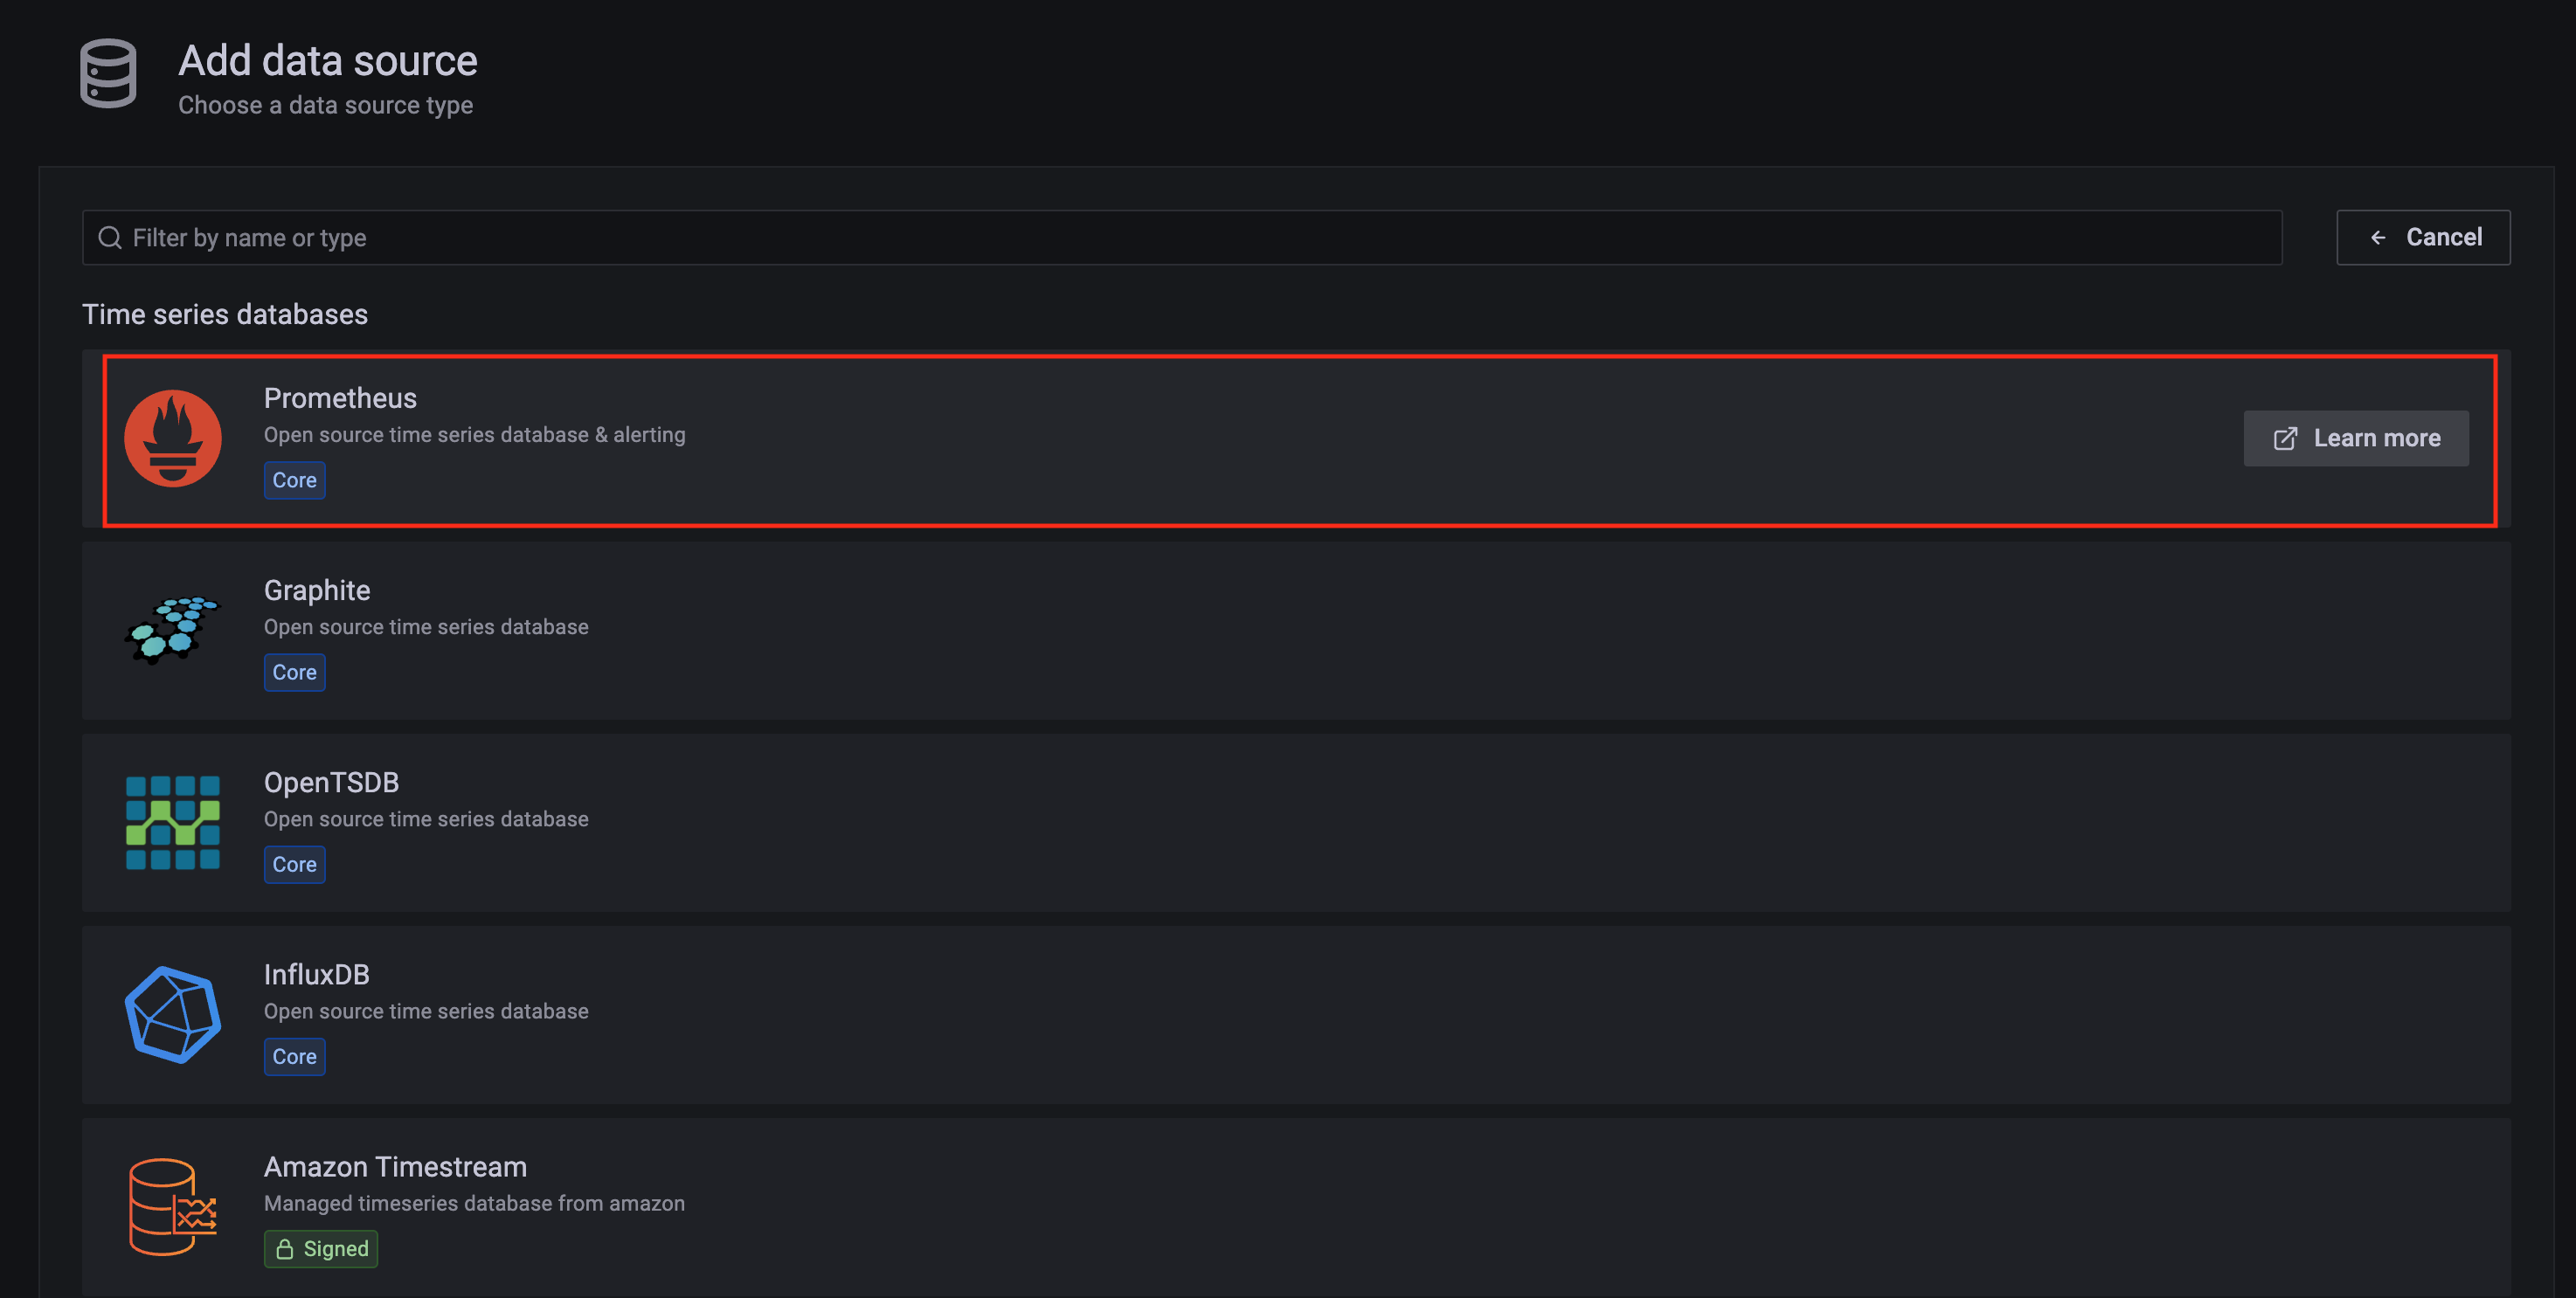
-
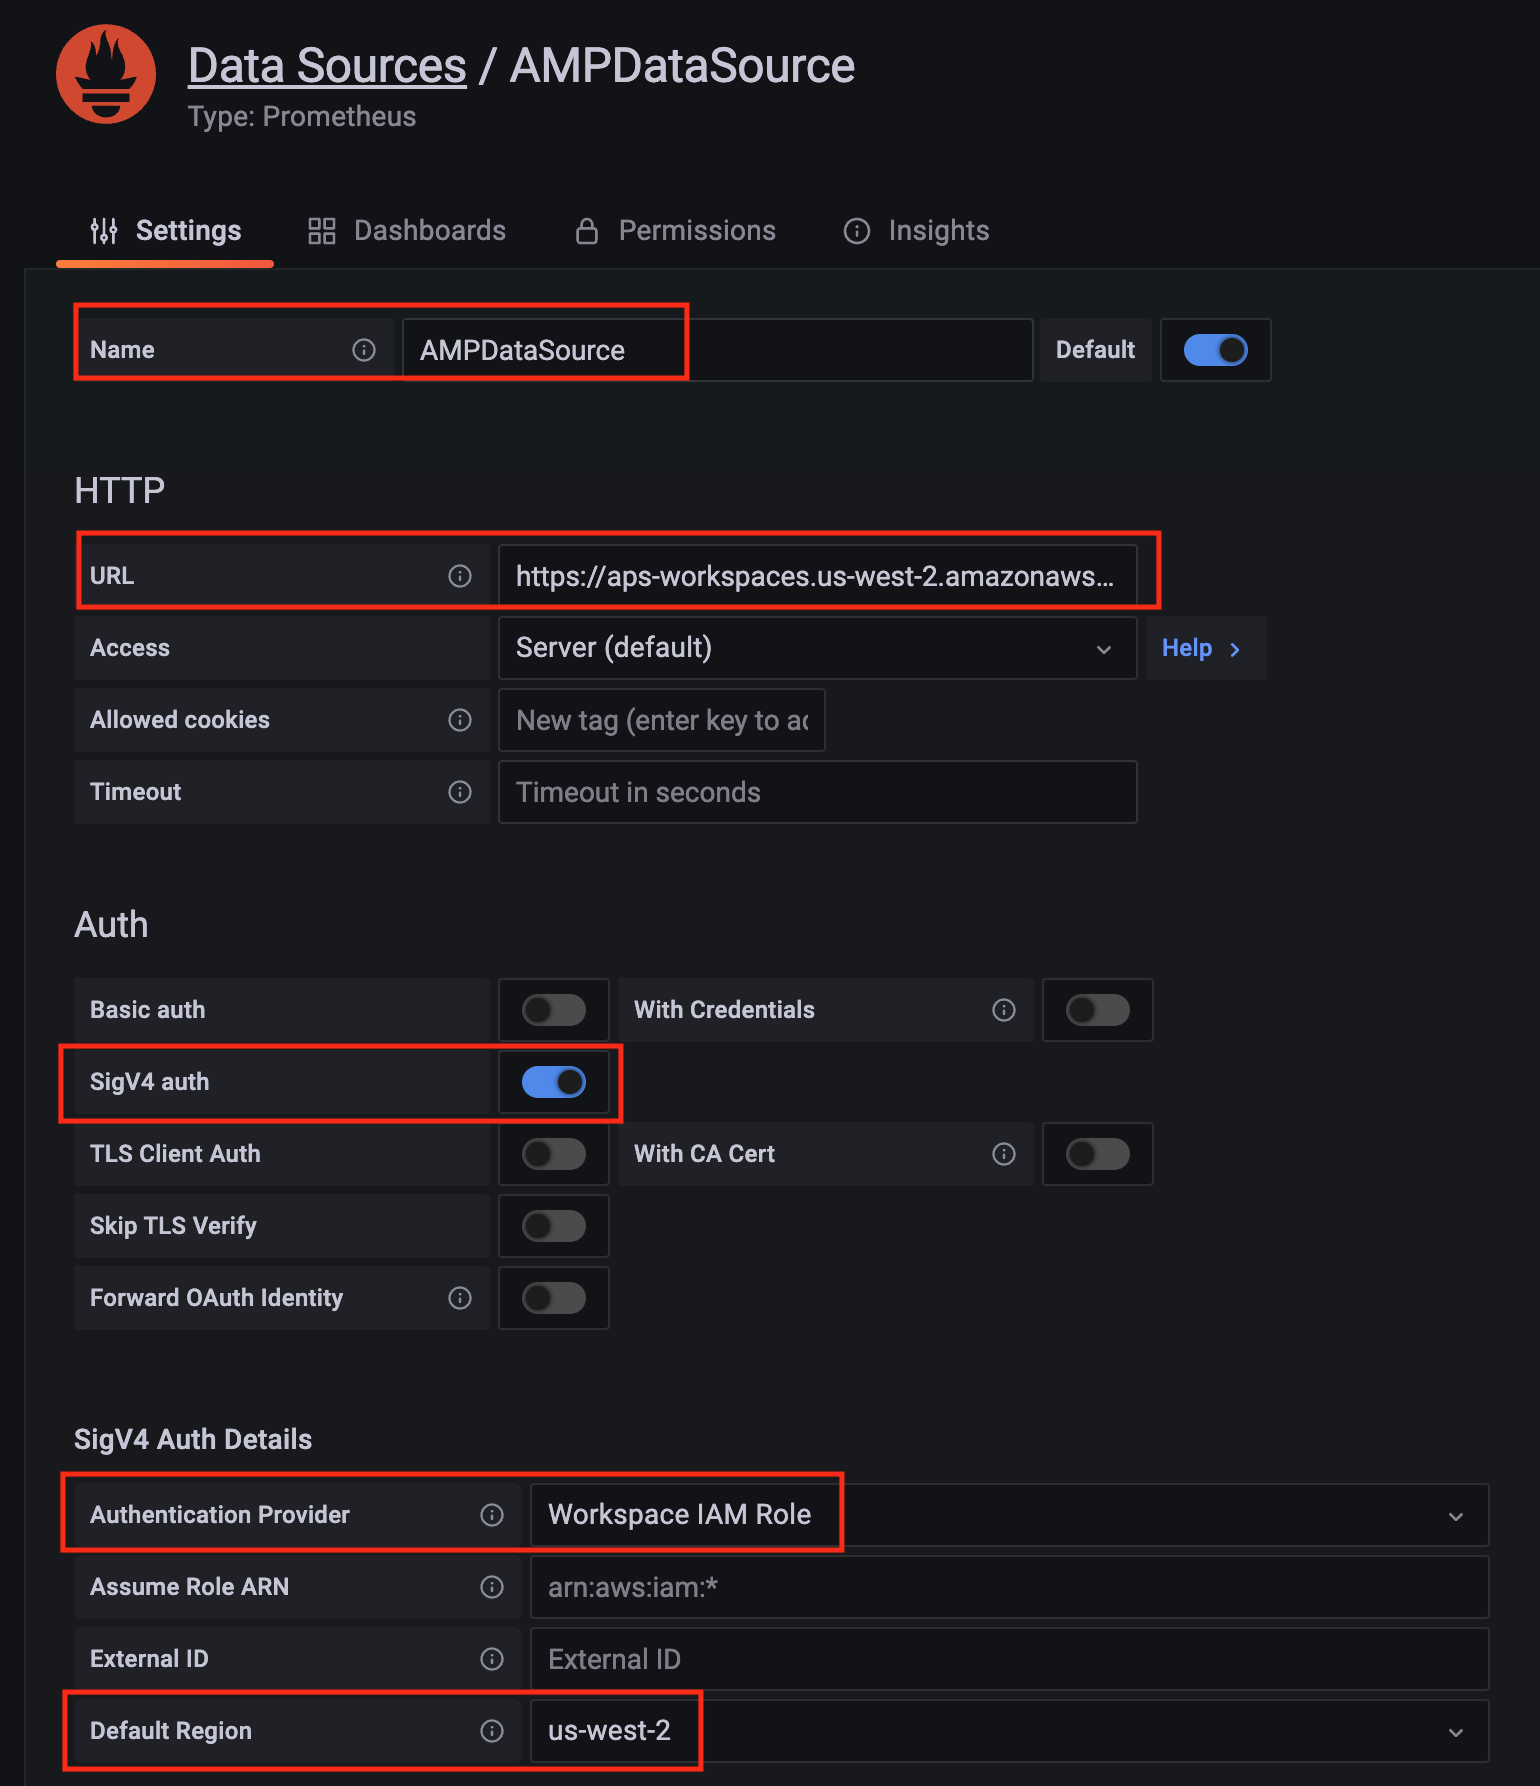
Configure Prometheus data source with the following details:
- Name:
AMPDataSourceas an example. - URL: add the AMP workspace remote write URL without the
api/v1/remote_writeat the end. - SigV4 auth: enable.
- Under the SigV4 Auth Details section:
- Authentication Provider: choose
Workspace IAM Role; - Default Region: choose
us-west-2(where you created the AMP workspace)
- Authentication Provider: choose
- Select the
Save and test, and a notificationdata source is workingshould be displayed.
- Name:
-
Import a dashboard template by clicking on the plus (+) sign on the left navigation bar. In the Import screen, type
3119in theImport via grafana.comtextbox and selectImport. From the dropdown at the bottom, selectAMPDataSourceand selectImport.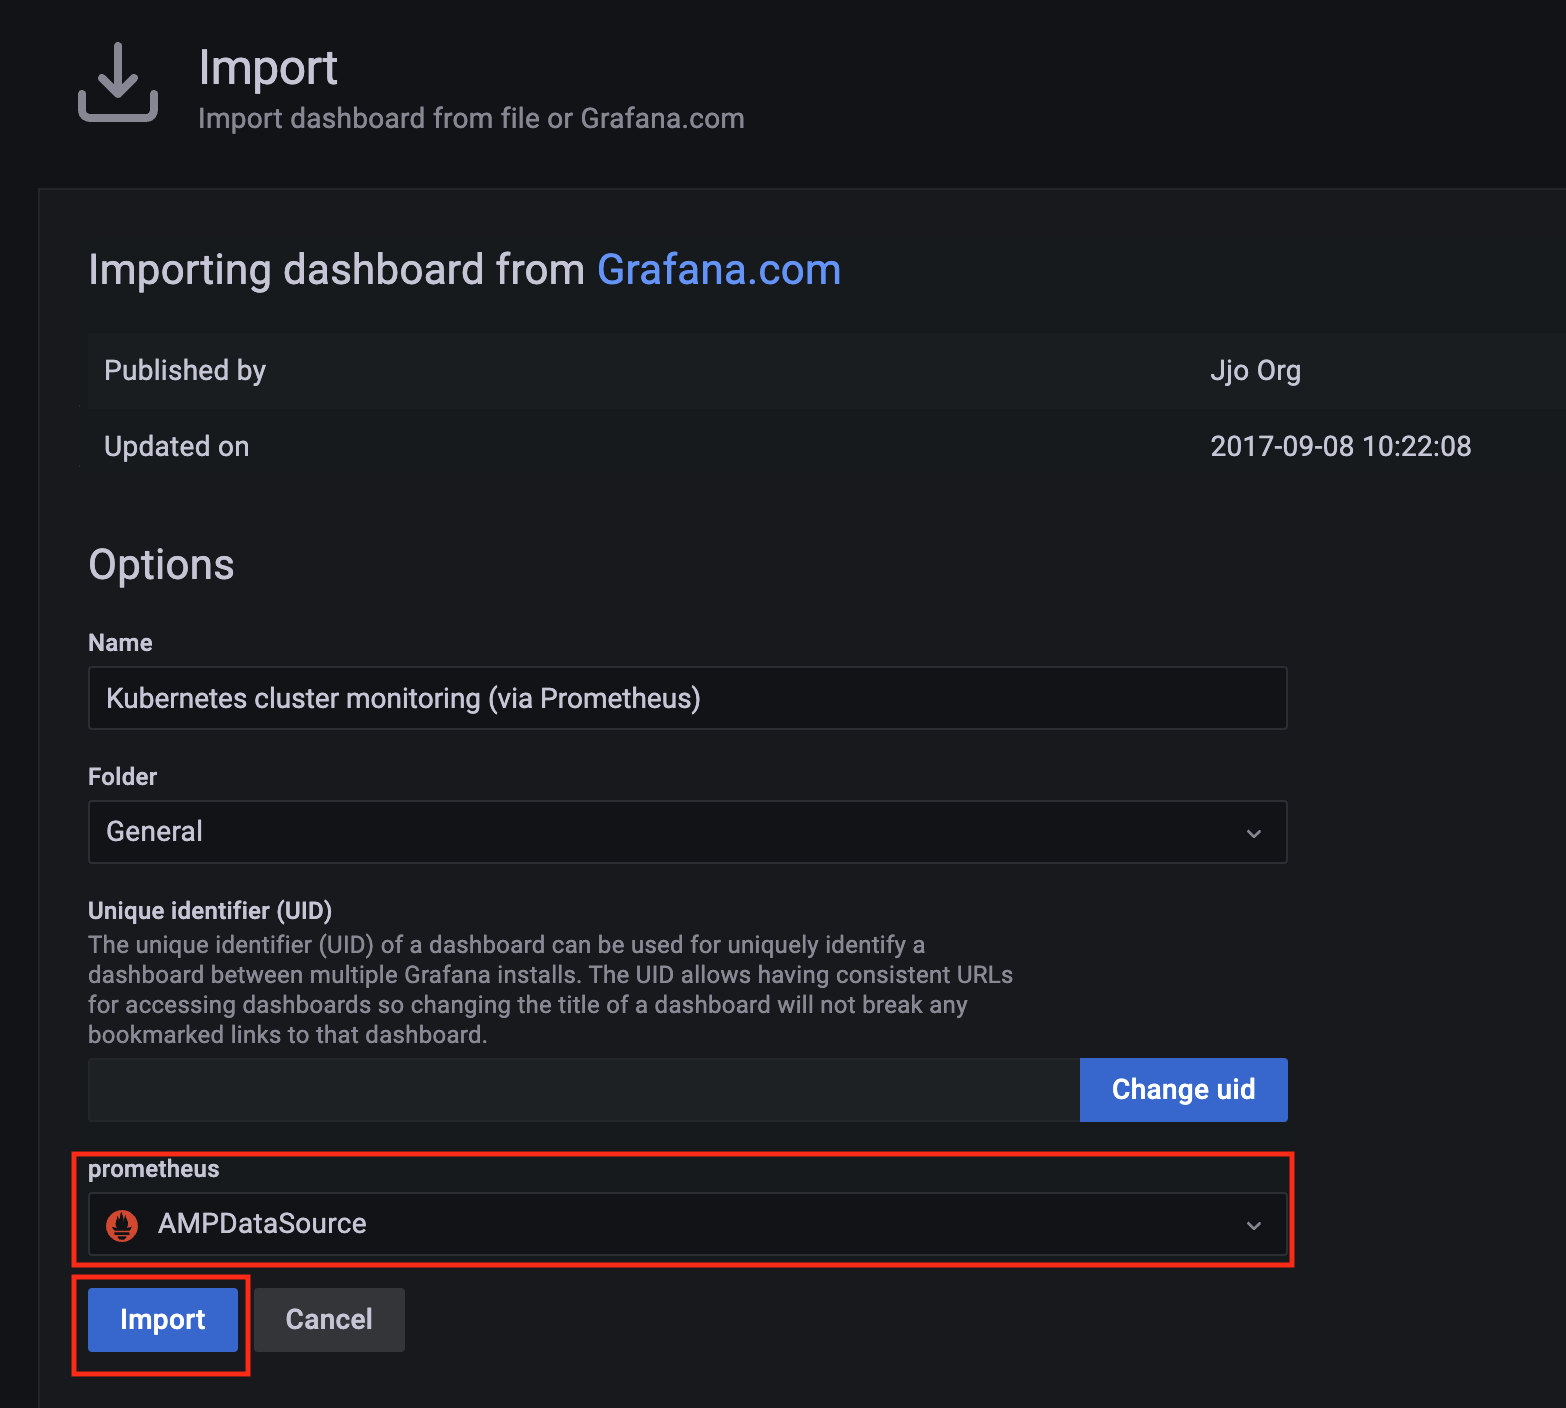
-
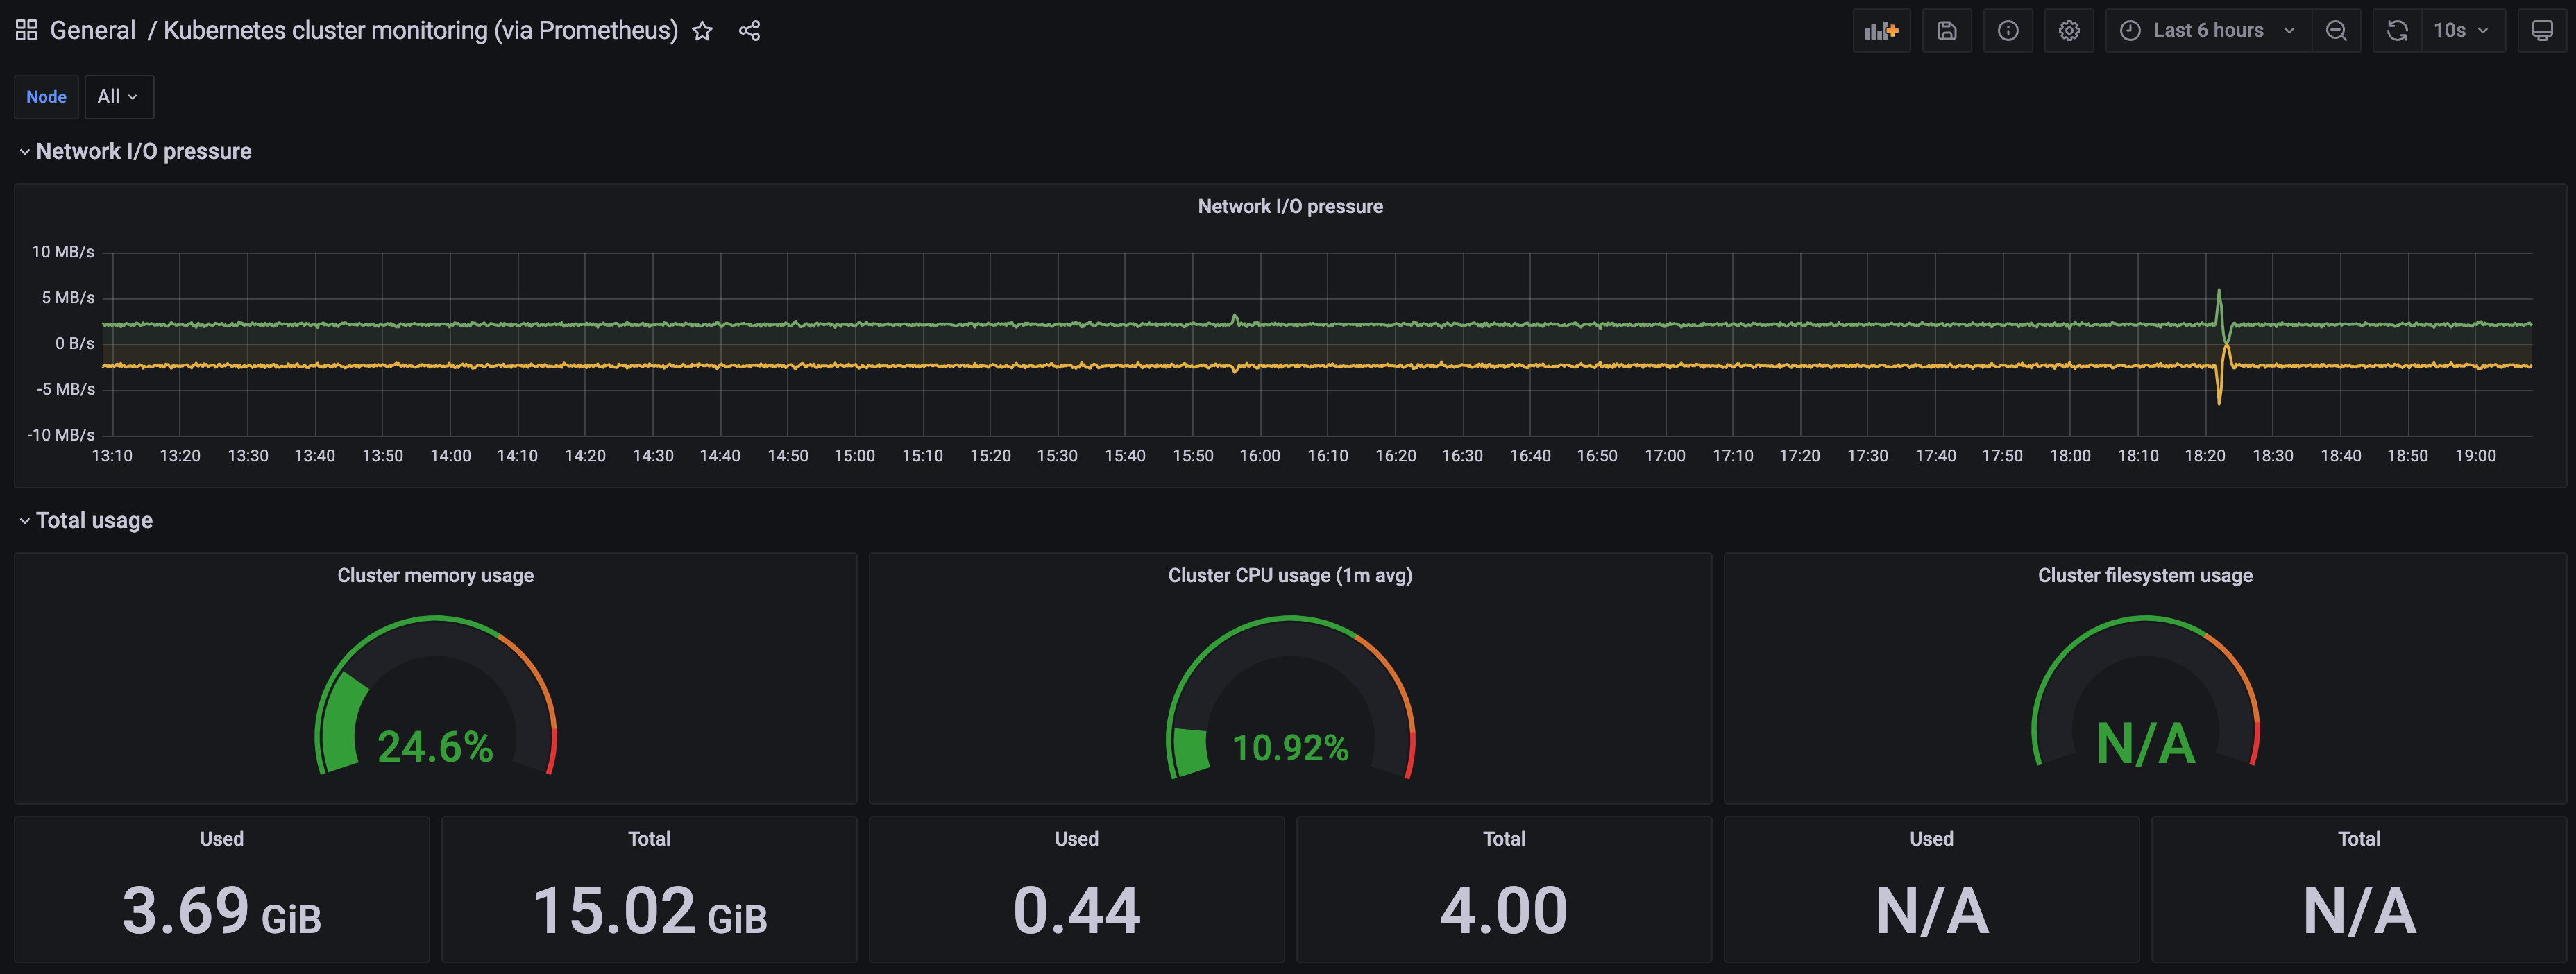
A
Kubernetes cluster monitoring (via Prometheus)dashboard will be displayed.