Prometheus with Grafana
This tutorial demonstrates how to config the Prometheus package to scrape metrics from an EKS Anywhere cluster, and visualize them in Grafana.
This tutorial walks through the following procedures:
Install the Prometheus package
The Prometheus package creates two components by default:
- Prometheus-server, which collects metrics from configured targets, and stores the metrics as time series data;
- Node-exporter, which exposes a wide variety of hardware- and kernel-related metrics for prometheus-server (or an equivalent metrics collector, i.e. ADOT collector) to scrape.
The prometheus-server is pre-configured to scrape the following targets at 1m interval:
- Kubernetes API servers
- Kubernetes nodes
- Kubernetes nodes cadvisor
- Kubernetes service endpoints
- Kubernetes services
- Kubernetes pods
- Prometheus-server itself
If no config modification is needed, a user can proceed to the Prometheus installation guide .
Prometheus Package Customization
In this section, we cover a few frequently-asked config customizations. After determining the appropriate customization, proceed to the Prometheus installation guide to complete the package installation. Also refer to Prometheus package spec for additional config options.
Change prometheus-server global configs
By default, prometheus-server is configured with evaluation_interval: 1m, scrape_interval: 1m, scrape_timeout: 10s. Those values can be overwritten if preferred / needed.
The following config allows the user to do such customization:
apiVersion: packages.eks.amazonaws.com/v1alpha1
kind: Package
metadata:
  name: generated-prometheus
  namespace: eksa-packages-<cluster-name>
spec:
  packageName: prometheus
  config: |
    server:
      global:
        evaluation_interval: "30s"
        scrape_interval: "30s"
        scrape_timeout: "15s"
Run prometheus-server as statefulSets
By default, prometheus-server is created as a deployment with replicaCount equals to 1. If there is a need to increase the replicaCount greater than 1, a user should deploy prometheus-server as a statefulSet instead. This allows multiple prometheus-server pods to share the same data storage.
The following config allows the user to do such customization:
apiVersion: packages.eks.amazonaws.com/v1alpha1
kind: Package
metadata:
  name: generated-prometheus
  namespace: eksa-packages-<cluster-name>
spec:
  packageName: prometheus
  config: |
    server:
      replicaCount: 2
      statefulSet:
        enabled: true
Disable prometheus-server and use node-exporter only
A user may disable the prometheus-server when:
- they would like to use node-exporter to expose hardware- and kernel-related metrics, while
- they have deployed another metrics collector in the cluster and configured a remote-write storage solution, which fulfills the prometheus-server functionality (check out the ADOT with Amazon Managed Prometheus and Amazon Managed Grafana workshop to learn how to do so).
The following config allows the user to do such customization:
    apiVersion: packages.eks.amazonaws.com/v1alpha1
    kind: Package
    metadata:
      name: generated-prometheus
      namespace: eksa-packages-<cluster-name>
    spec:
      packageName: prometheus
      config: |
        server:
          enabled: false
Disable node-exporter and use prometheus-server only
A user may disable the node-exporter when:
- they would like to deploy multiple prometheus-server packages for a cluster, while
- deploying only one or none node-exporter instance per node.
The following config allows the user to do such customization:
    apiVersion: packages.eks.amazonaws.com/v1alpha1
    kind: Package
    metadata:
      name: generated-prometheus
      namespace: eksa-packages-<cluster-name>
    spec:
      packageName: prometheus
      config: |
        nodeExporter:
          enabled: false
Prometheus Package Test
To ensure the Prometheus package is installed correctly in the cluster, a user can perform the following tests.
Access prometheus-server web UI
Port forward Prometheus to local host 9090:
export PROM_SERVER_POD_NAME=$(kubectl get pods --namespace <namespace> -l "app.kubernetes.io/name=prometheus,app.kubernetes.io/component=server" -o jsonpath="{.items[0].metadata.name")
kubectl port-forward $PROM_SERVER_POD_NAME -n <namespace> 9090
Go to http://localhost:9090 to access the web UI.
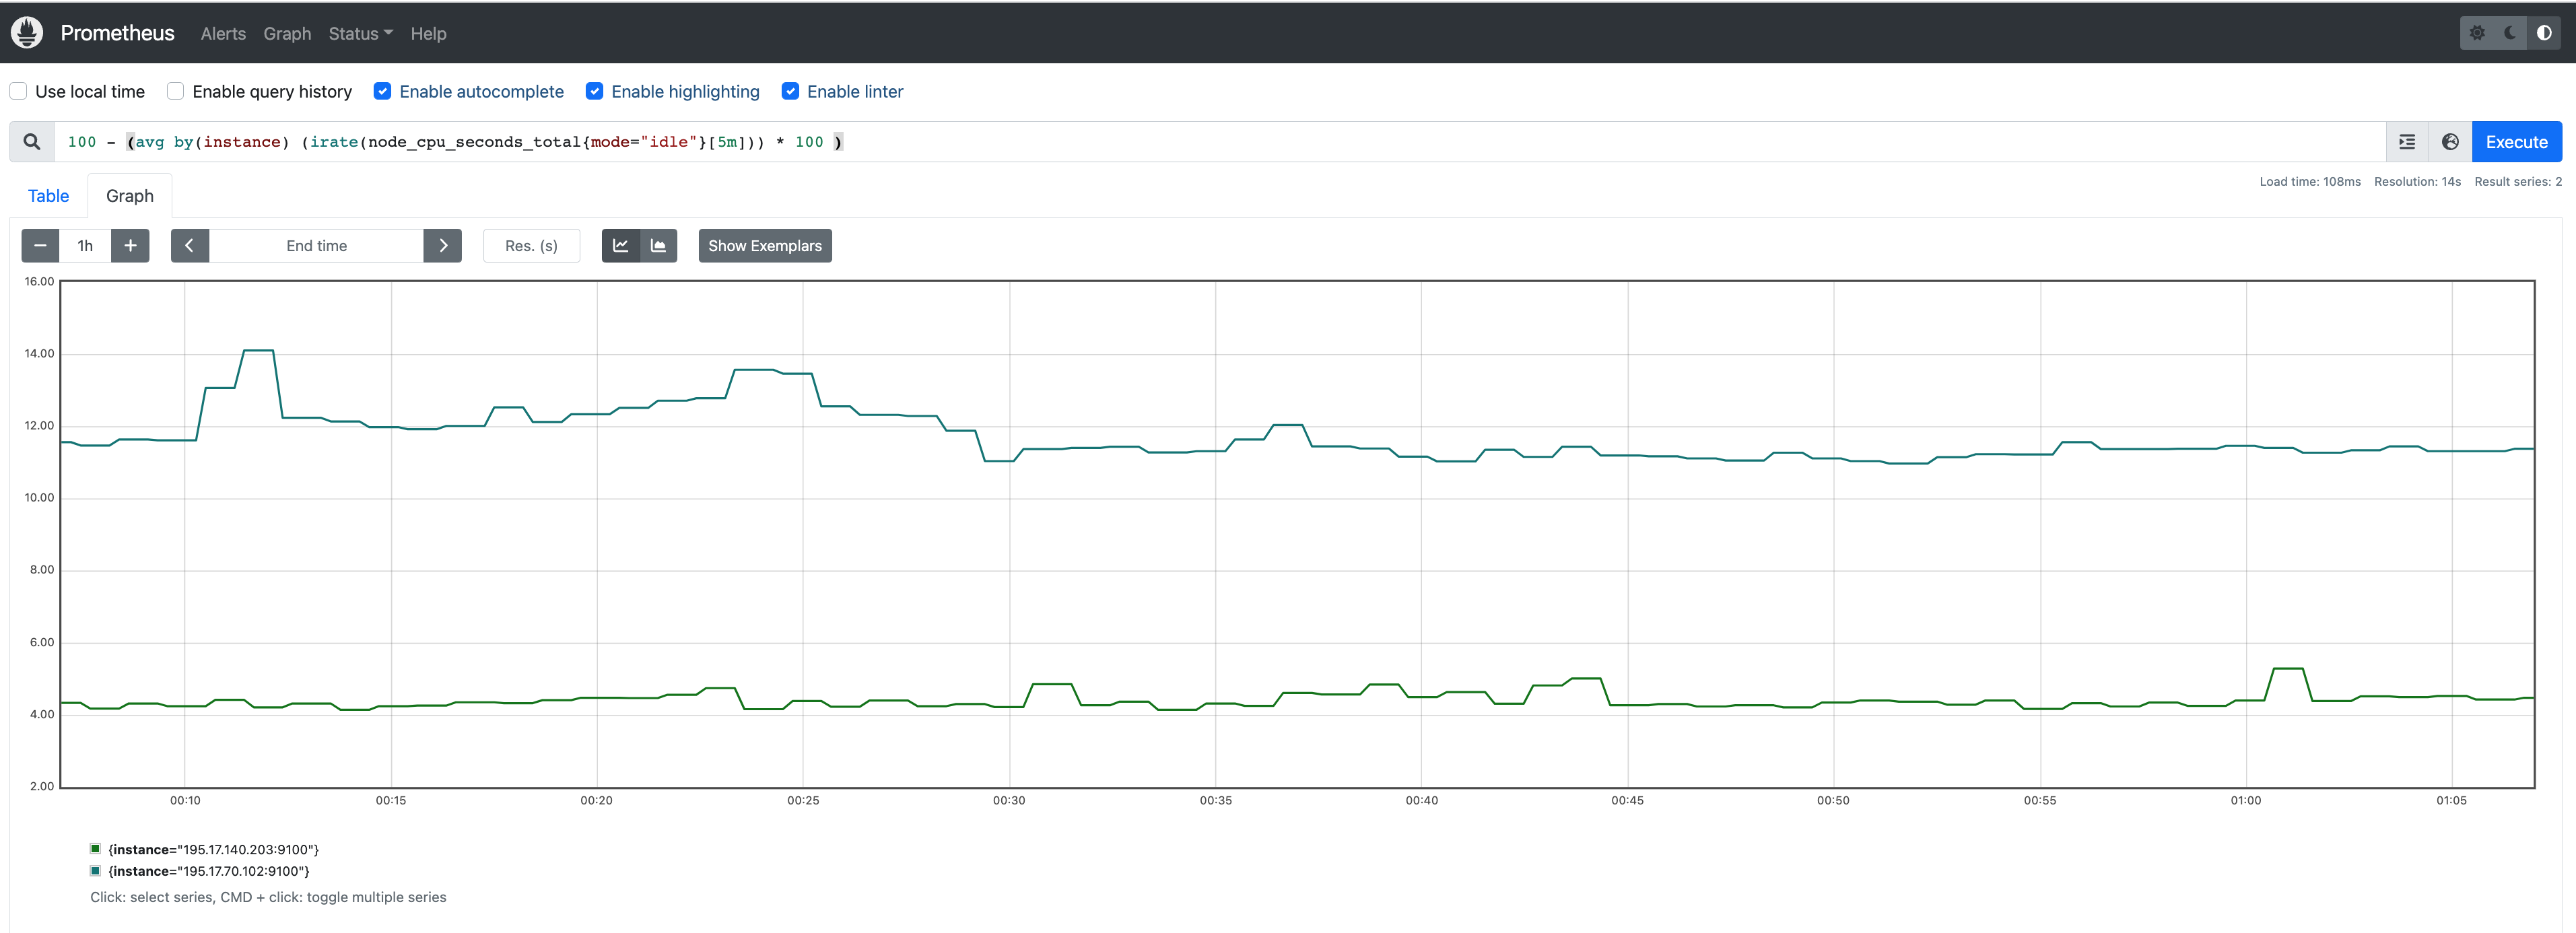
Run sample queries
Run sample queries in Prometheus web UI to confirm the targets have been configured properly. For example, a user can run the following query to obtain the CPU utilization rate by node.
100 - (avg by(instance) (irate(node_cpu_seconds_total{mode="idle"}[5m])) * 100 )
The output will be displayed on the Graph tab.
Install Grafana helm charts
A user can install Grafana in the cluster to visualize the Prometheus metrics. We used the Grafana helm chart as an example below, though other deployment methods are also possible.
-
Get helm chart repo info
helm repo add grafana https://grafana.github.io/helm-charts helm repo update -
Install the helm chart
helm install my-grafana grafana/grafana
Set up Grafana dashboards
Access Grafana web UI
-
Obtain Grafana login password:
kubectl get secret --namespace default my-grafana -o jsonpath="{.data.admin-password}" | base64 --decode; echo -
Port forward Grafana to local host
3000:export GRAFANA_POD_NAME=$(kubectl get pods --namespace default -l "app.kubernetes.io/name=grafana,app.kubernetes.io/instance=my-grafana" -o jsonpath="{.items[0].metadata.name}") kubectl --namespace default port-forward $GRAFANA_POD_NAME 3000 -
Go to http://localhost:3000 to access the web UI. Log in with username
admin, and password obtained from the Obtain Grafana login password in step 1 above.
Add Prometheus data source
-
Click on the
Configurationsign on the left navigation bar, selectData sources, then choosePrometheusas theData source.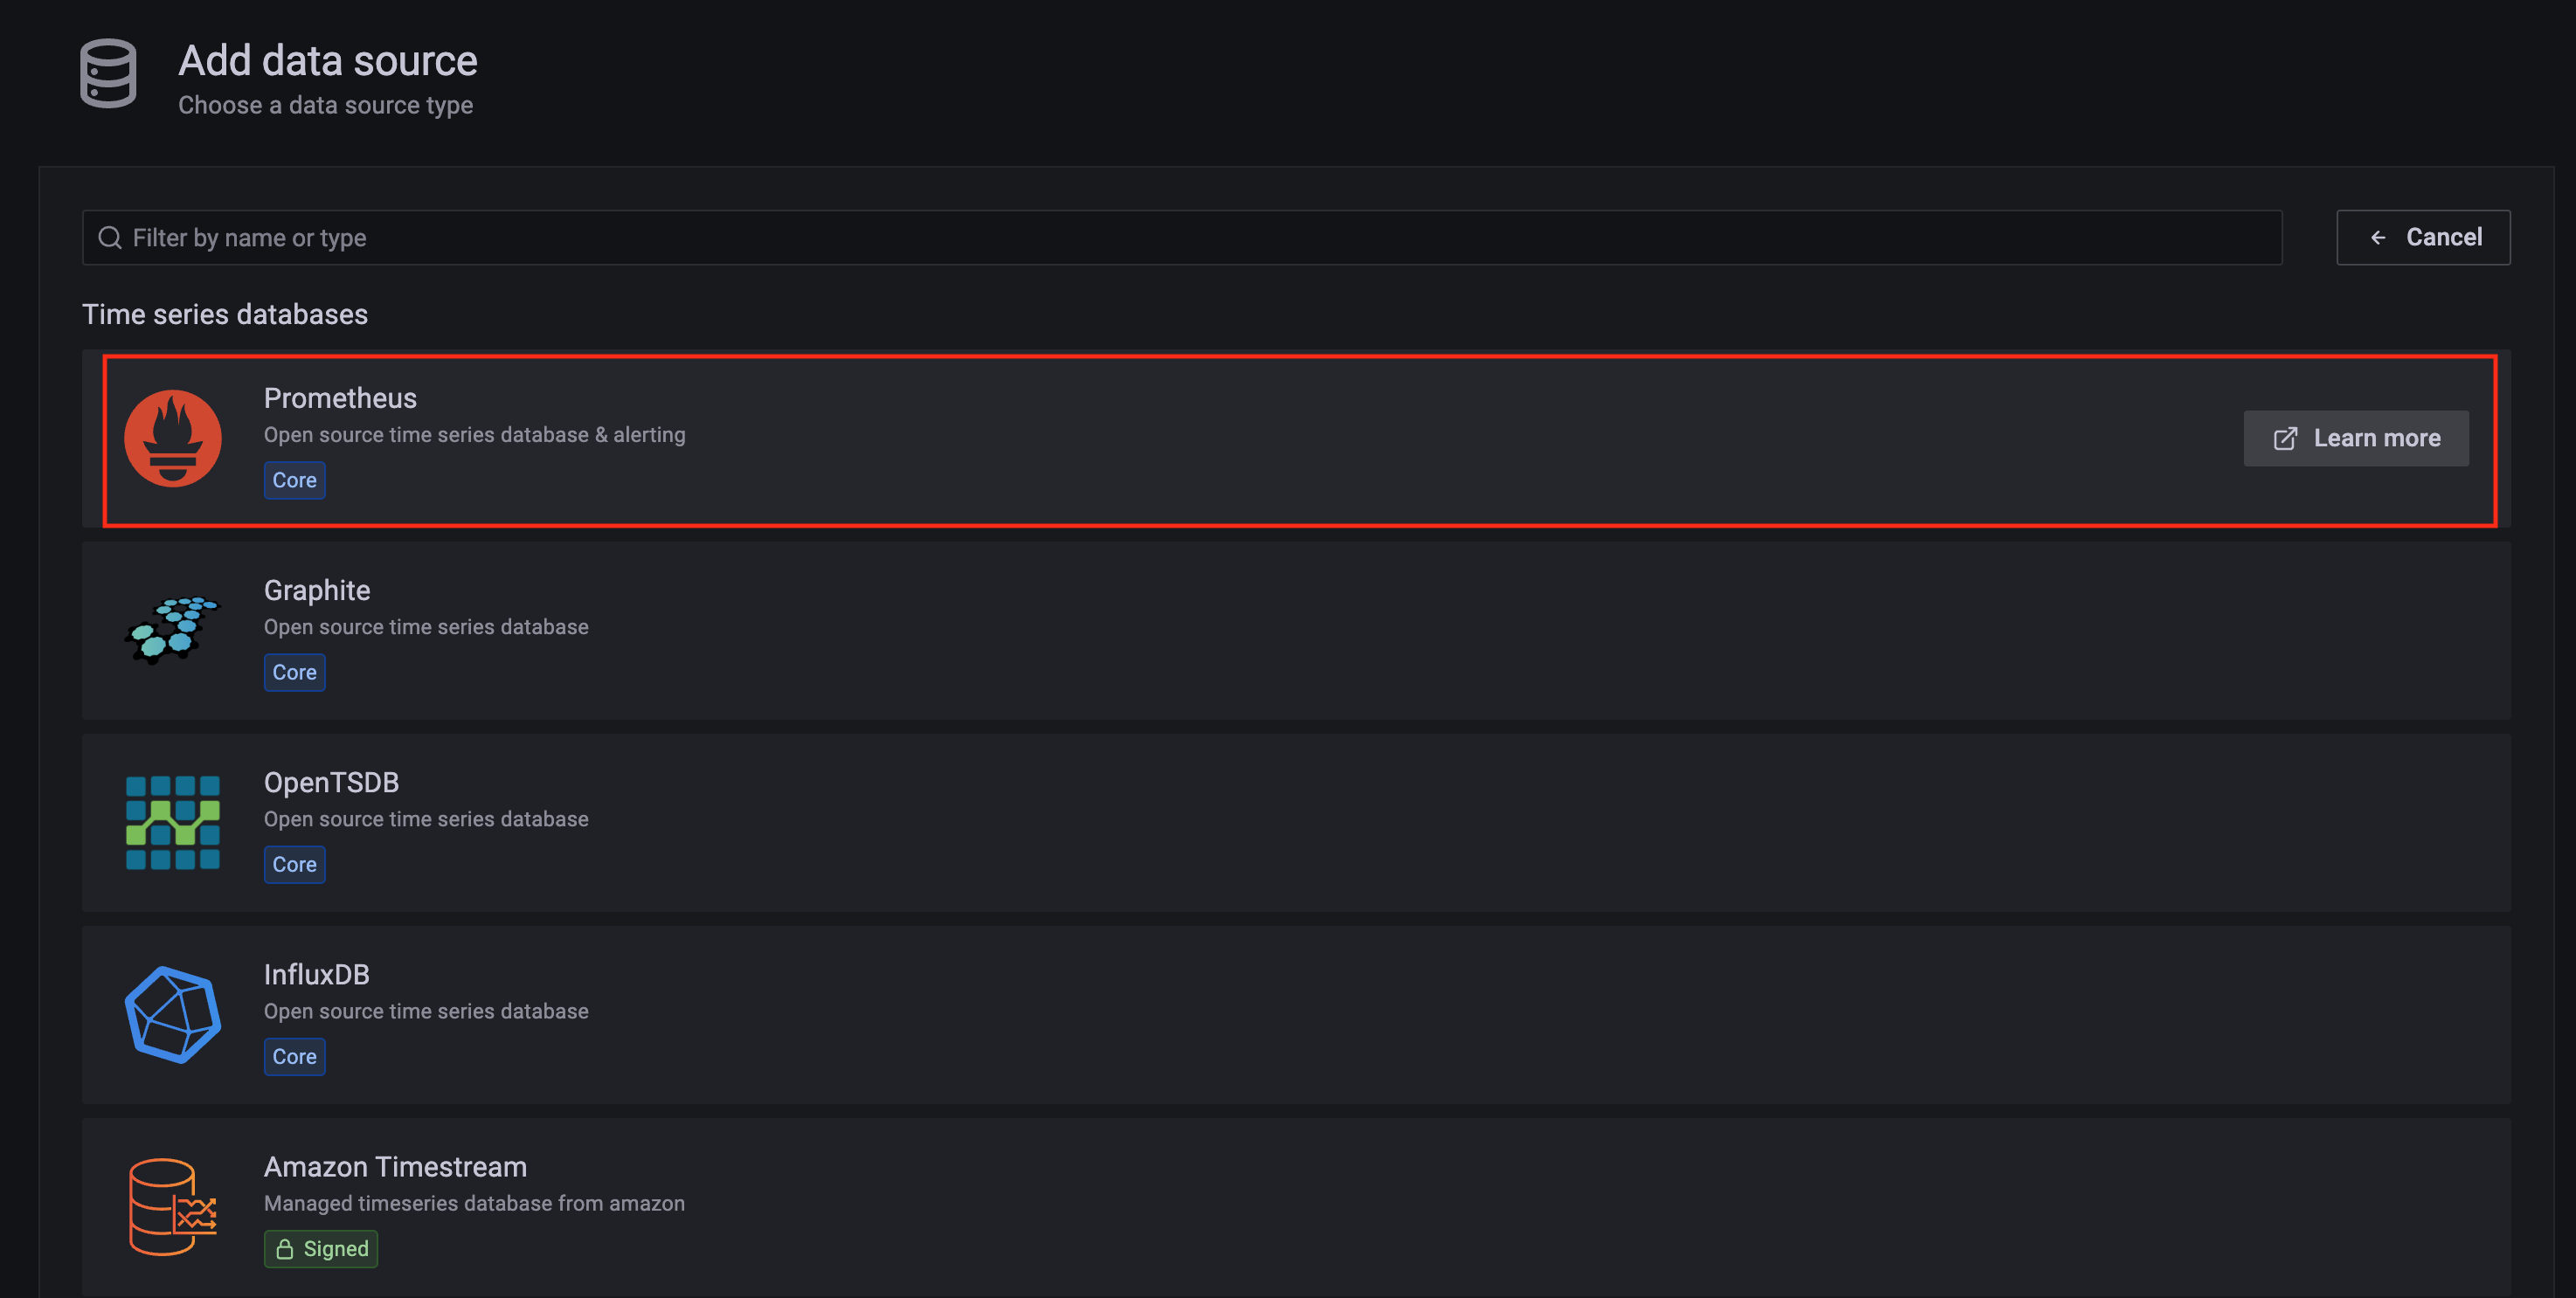
-
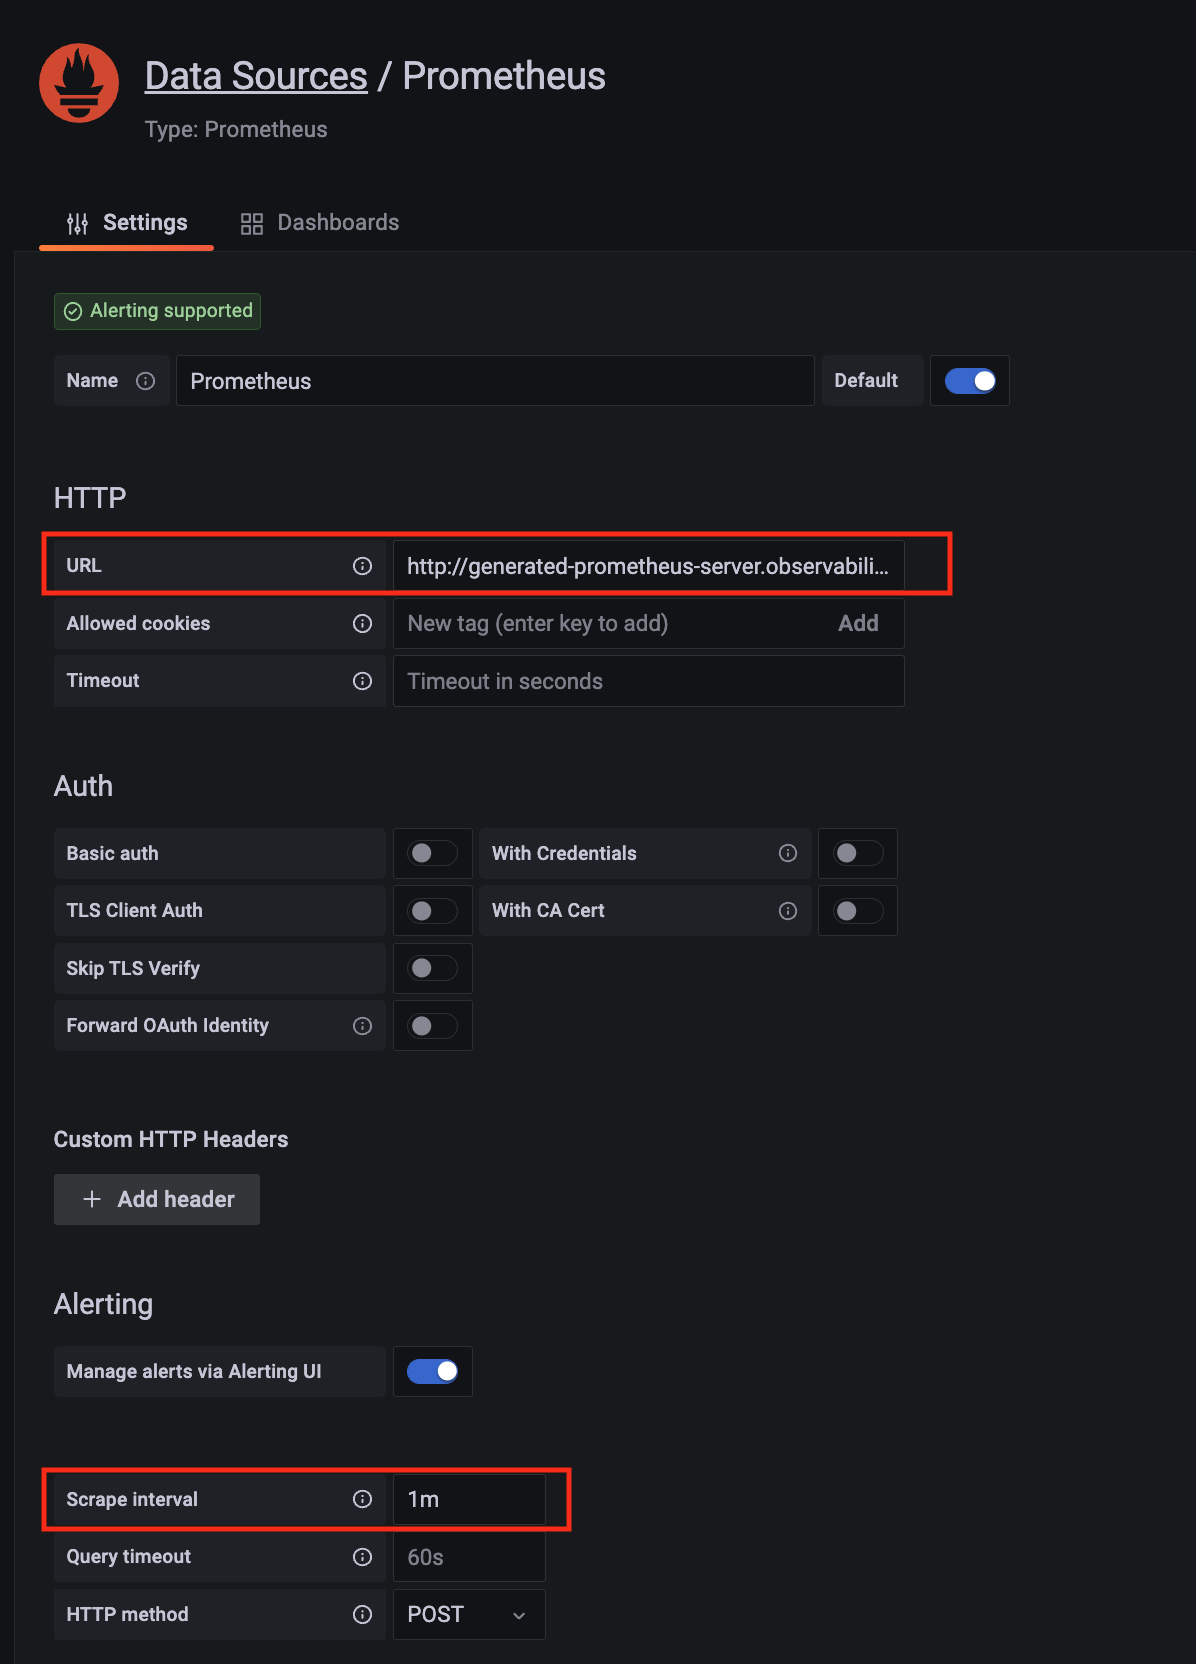
Configure Prometheus data source with the following details:
- Name:
Prometheusas an example. - URL:
http://<prometheus-server-end-point-name>.<namespace>:9090. If the package default values are used, this will behttp://generated-prometheus-server.observability:9090. - Scrape interval:
1mor the value specified by user in the package config. - Select
Save and test. A notificationdata source is workingshould be displayed.
- Name:
Import dashboard templates
-
Import a dashboard template by hovering over to the
Dashboardsign on the left navigation bar, and click onImport. Type315in theImport via grafana.comtextbox and selectImport. From the dropdown at the bottom, selectPrometheusand selectImport.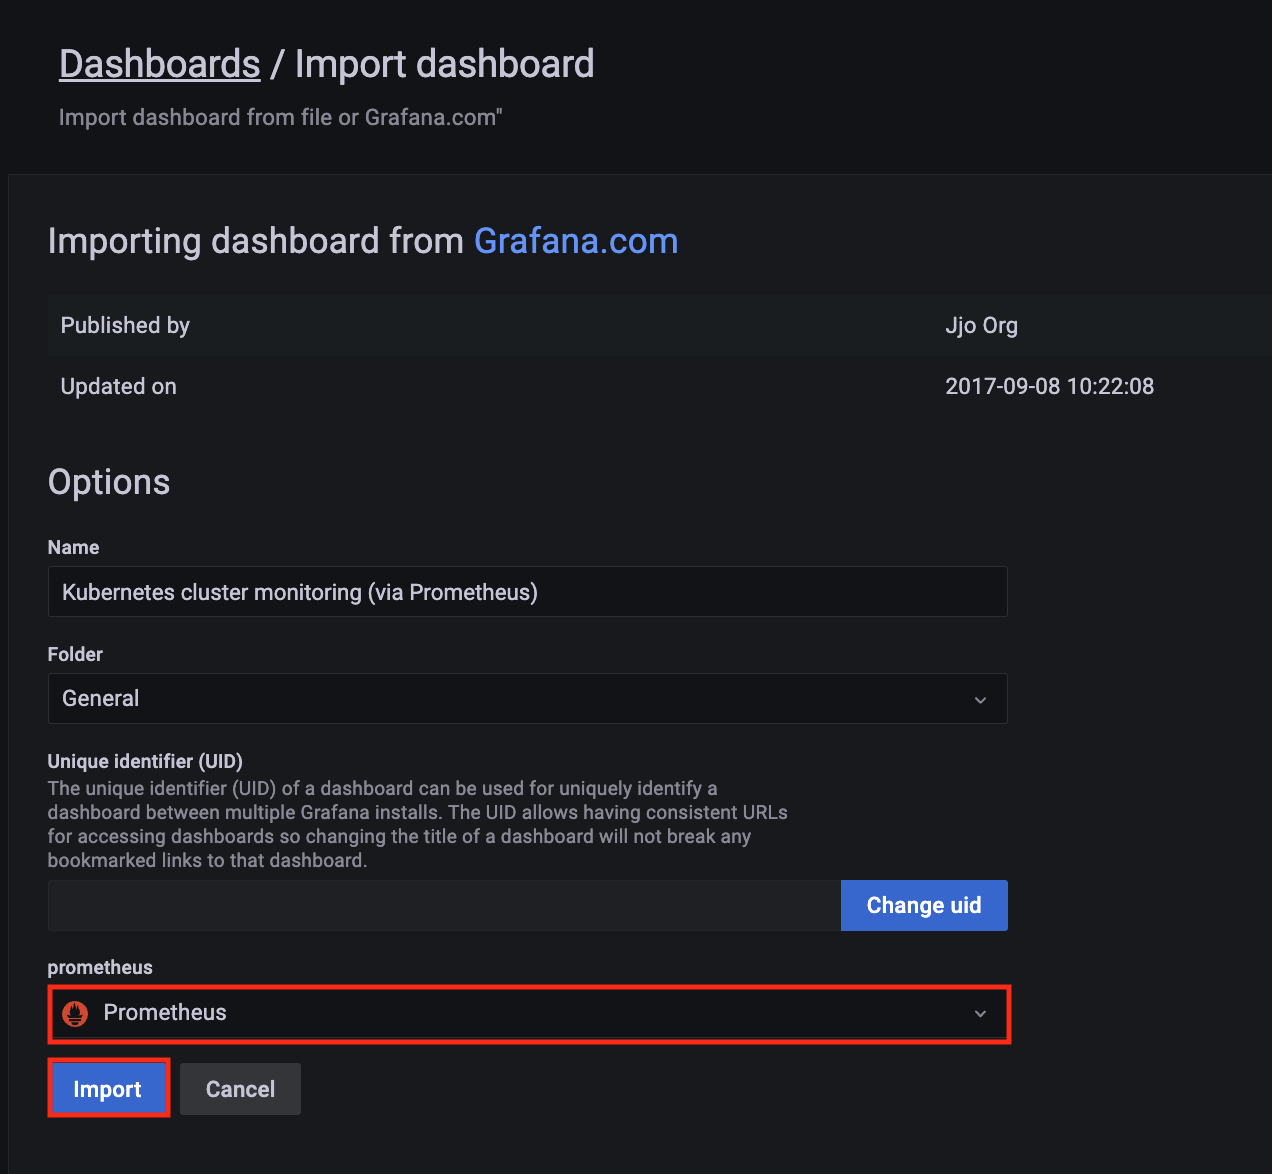
-
A
Kubernetes cluster monitoring (via Prometheus)dashboard will be displayed.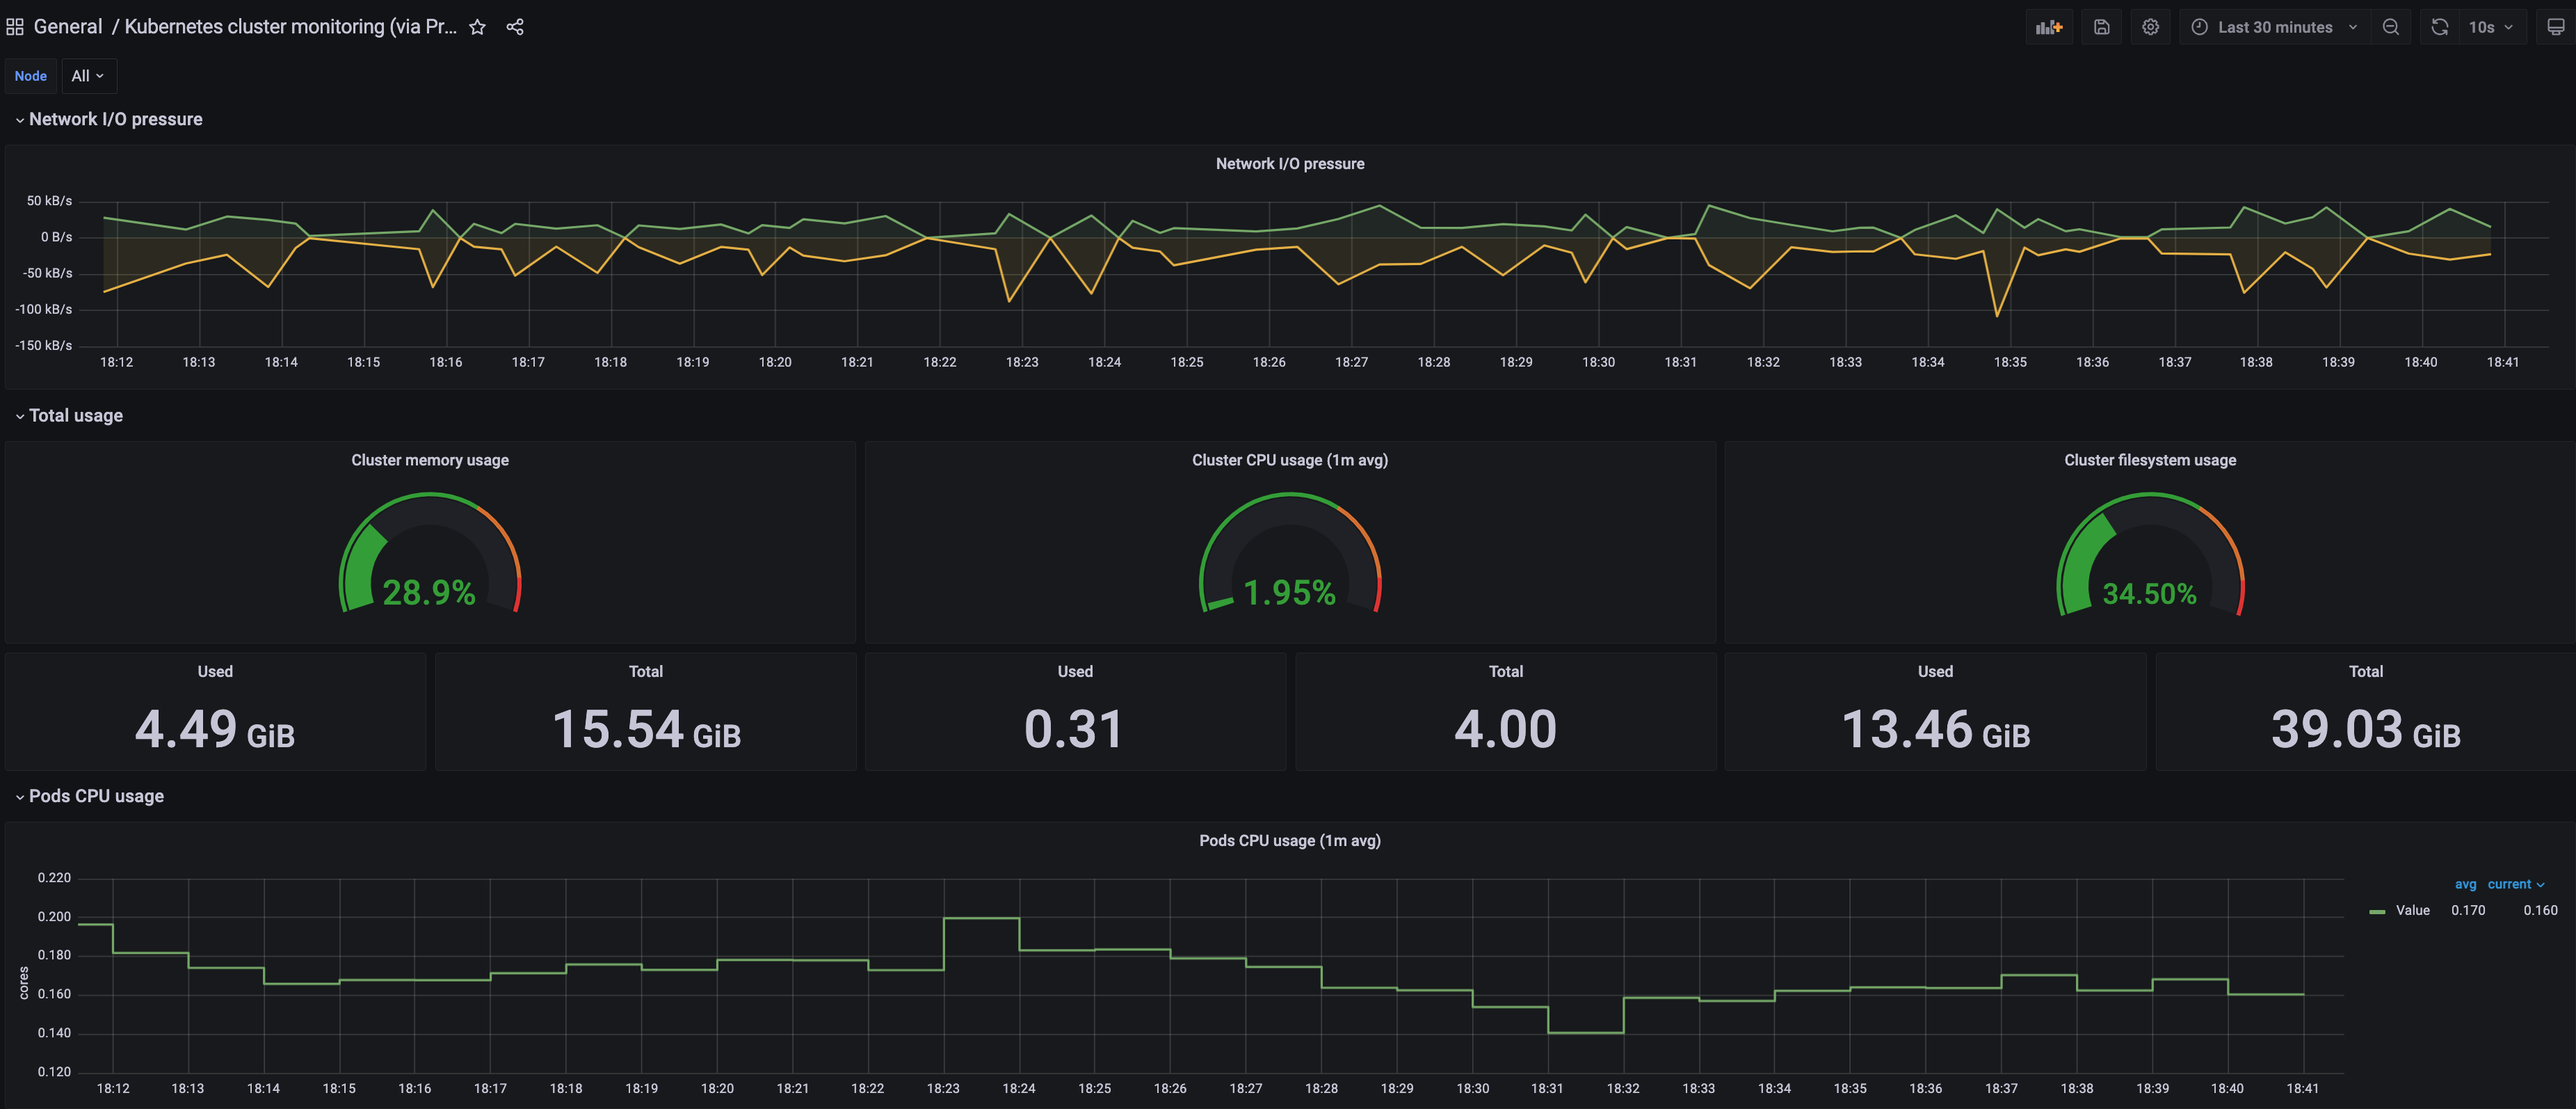
-
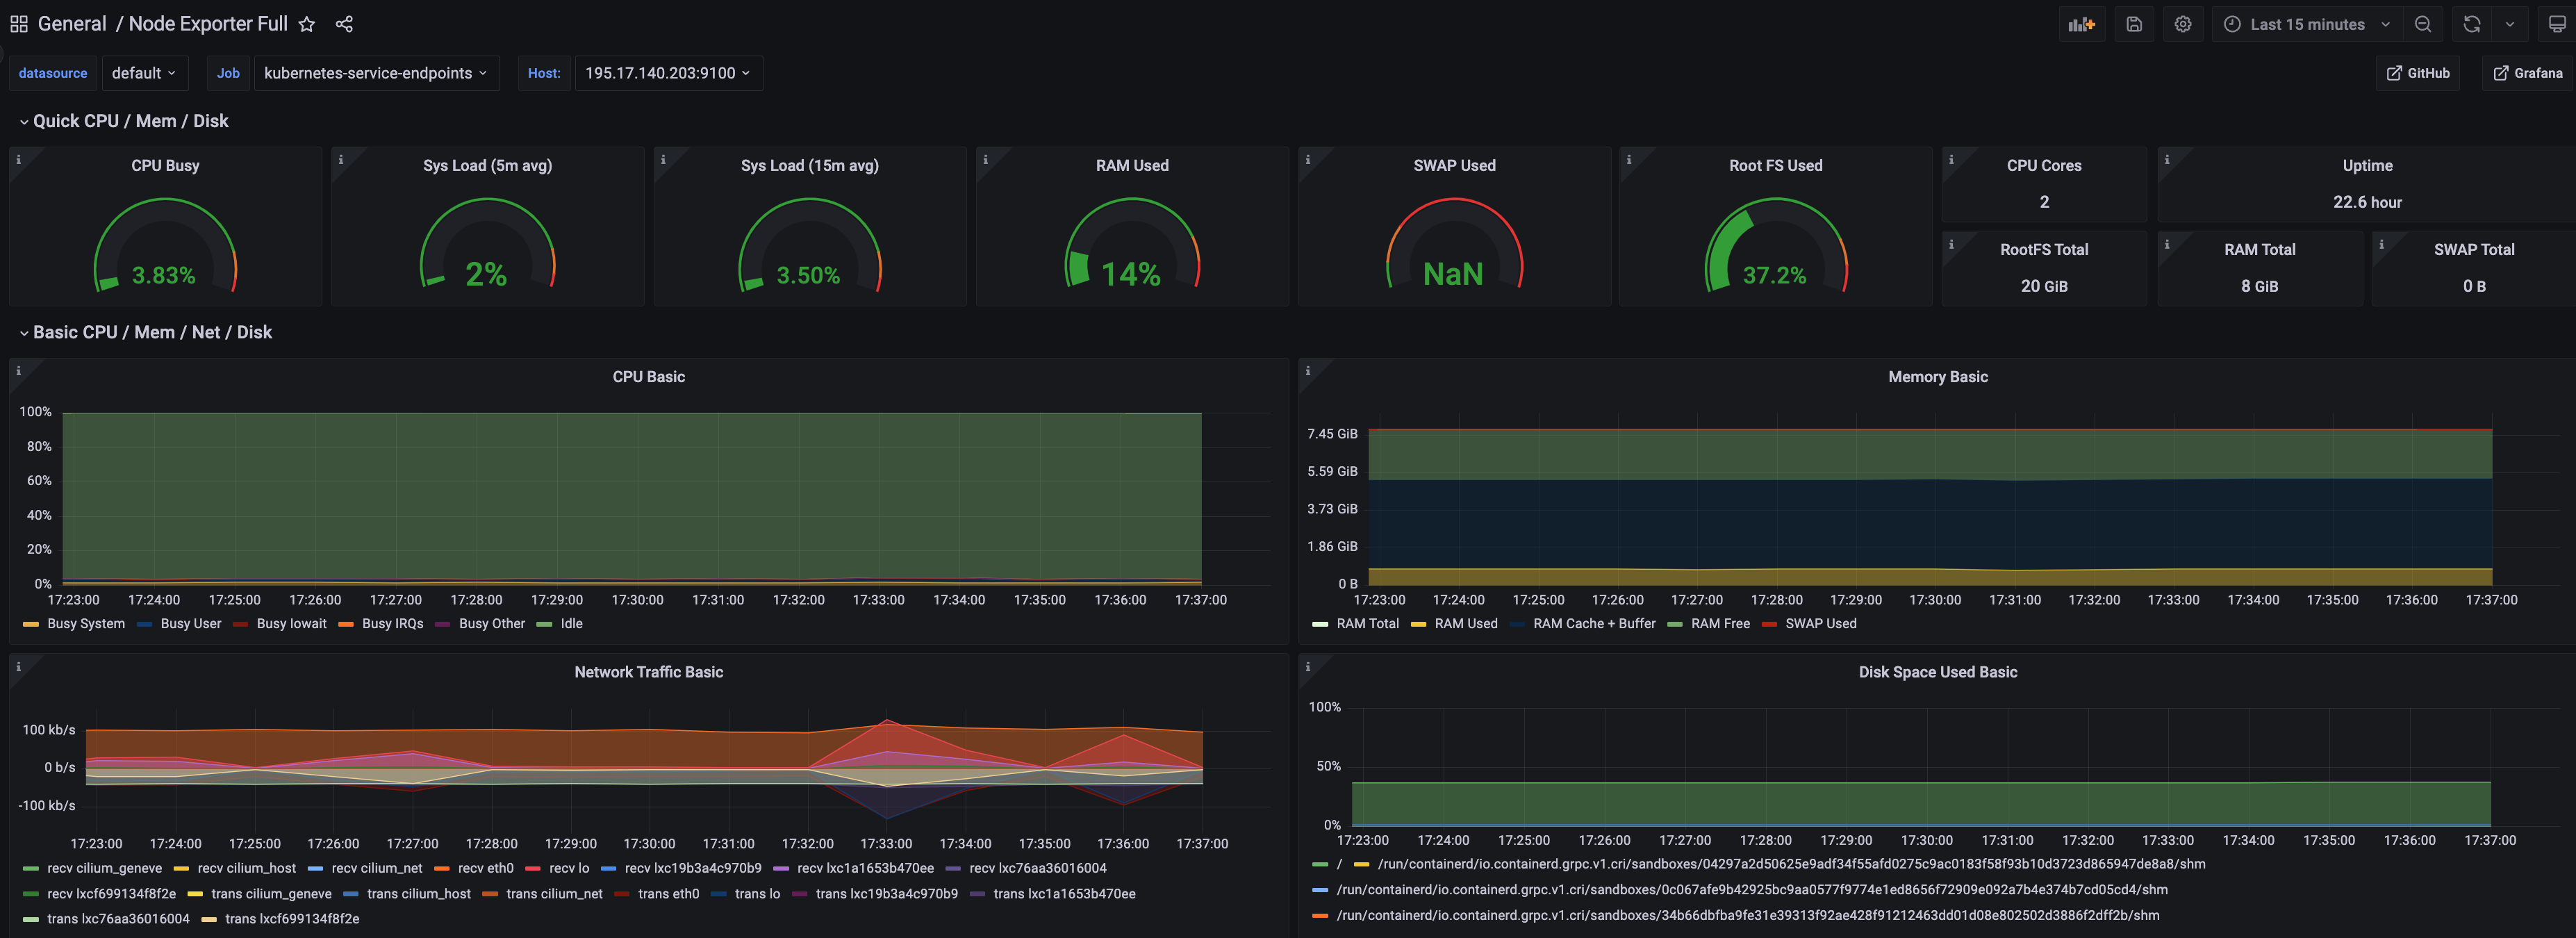
Perform the same procedure for template
1860. ANode Exporter Fulldashboard will be displayed.