Configure Fluent Bit for CloudWatch
Fluent Bit is an open source, multi-platform log processor and forwarder which allows you to collect data/logs from different sources, then unify and send them to multiple destinations. It’s fully compatible with Docker and Kubernetes environments. Due to its lightweight nature, using Fluent Bit as the log forwarder for EKS Anywhere clusters enables you to stream application logs into Amazon CloudWatch Logs efficiently and reliably.
You can additionally use CloudWatch Container Insights to collect, aggregate, and summarize metrics and logs from your containerized applications and microservices running on EKS Anywhere clusters. CloudWatch automatically collects metrics for many resources, such as CPU, memory, disk, and network. Container Insights also provides diagnostic information, such as container restart failures, to help you isolate issues and resolve them quickly. You can also set CloudWatch alarms on metrics that Container Insights collects.
On this page, we show how to set up Fluent Bit and Container Insights to send logs and metrics from your EKS Anywhere clusters to CloudWatch.
Prerequisites
- An AWS Account (see AWS documentation to get started)
- An EKS Anywhere cluster with IAM Roles for Service Account (IRSA) enabled: With IRSA, an IAM role can be associated with a Kubernetes service account. This service account can provide AWS permissions to the containers in any Pod that use the service account, which enables the containers to securely communicate with AWS services. This removes the need to hardcode AWS security credentials as environment variables on your nodes. See the IRSA configuration page for details.
Note
- The example uses
eksapocas the EKS Anywhere cluster name. You must adjust the configuration in the examples below if you use a different cluster name. Specifically, make sure to adjust thefluentbit.yamlmanifest accordingly. - The example uses the
us-west-2AWS Region. You must adjust the configuration in the examples below if you are using a different region.
Before setting up Fluent Bit, first create an IAM Policy and Role to send logs to CloudWatch.
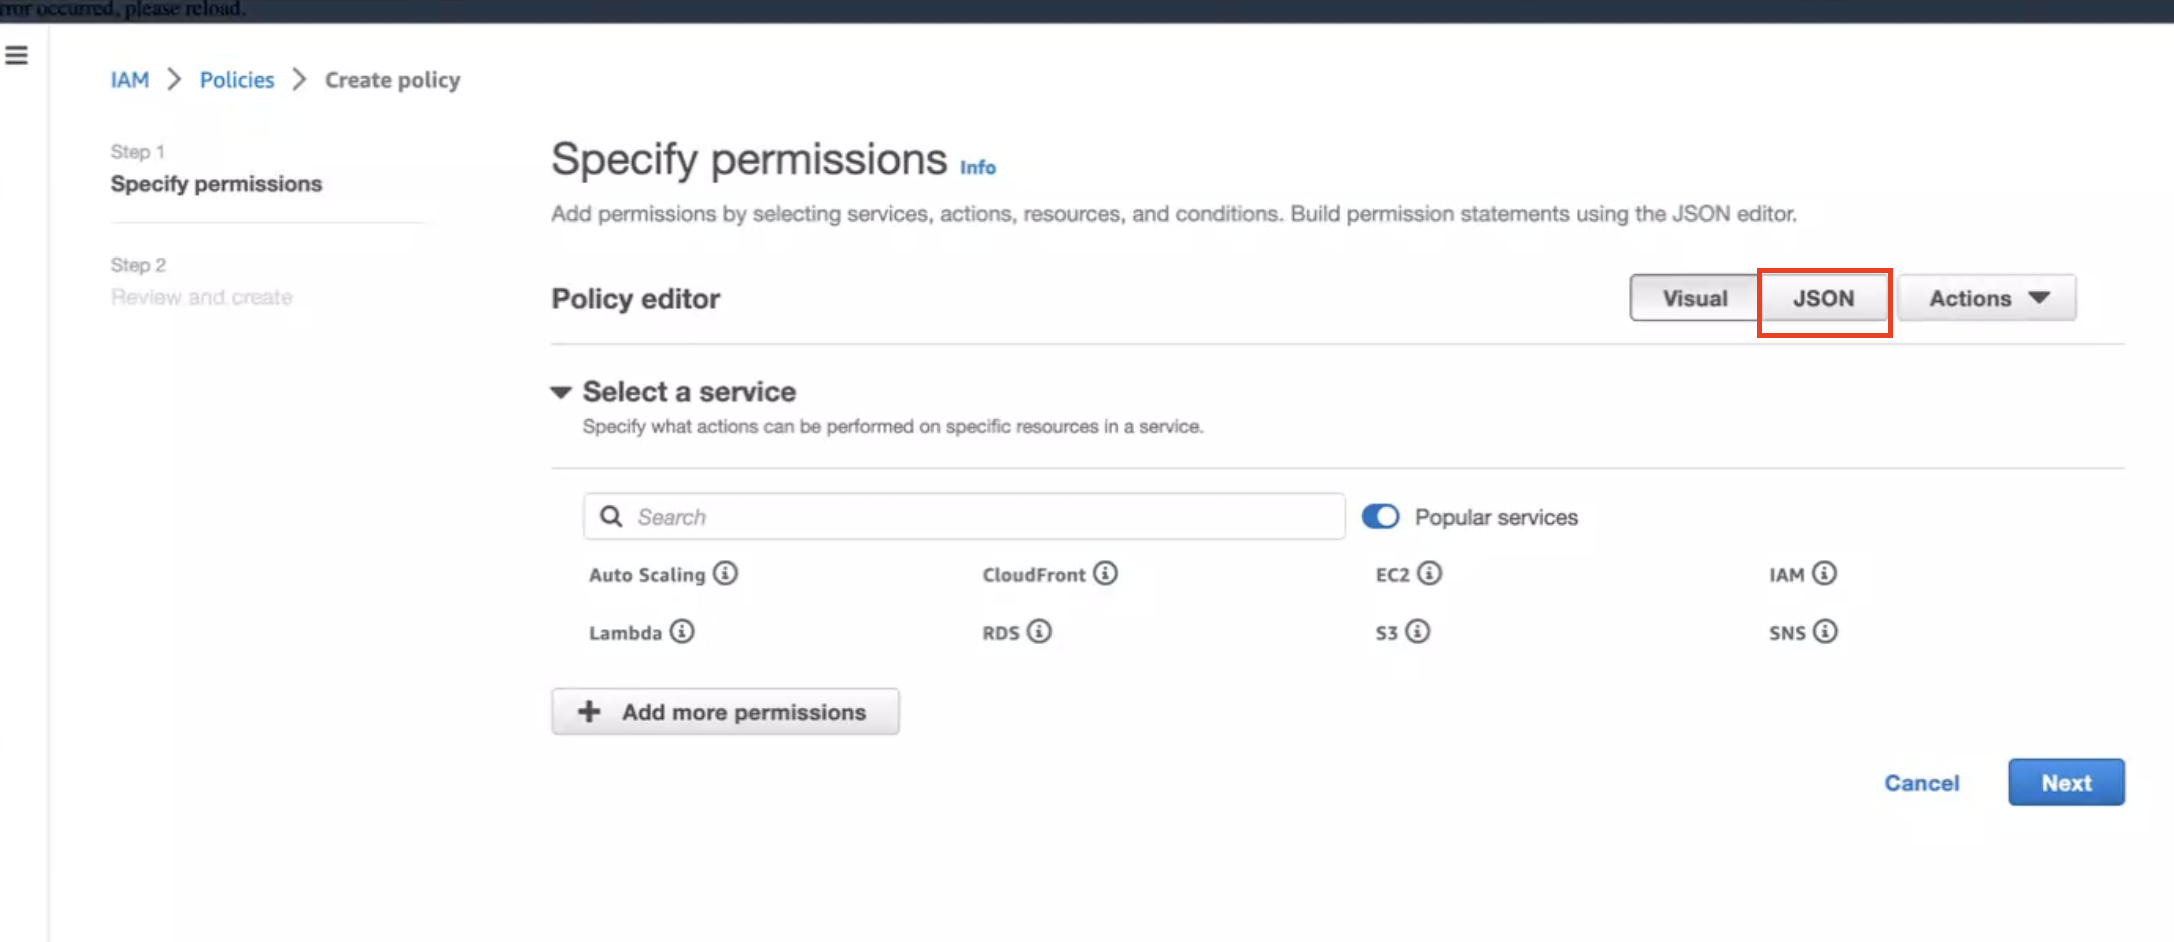
Step 1: Create IAM Policy
-
Go to IAM Policy in the AWS console.
-
Click on JSON as shown below:
-
Create below policy on the IAM Console. Click on Create Policy as shown:
        {
            "Version": "2012-10-17",
            "Statement": [
                {
                    "Sid": "EKSAnywhereLogging",
                    "Effect": "Allow",
                    "Action": "cloudwatch:*",
                    "Resource": "*"
                }
            ]
        }
Step 2: Create IAM Role
-
Go to IAM Role in the AWS console.
-
Follow the steps as shown below:
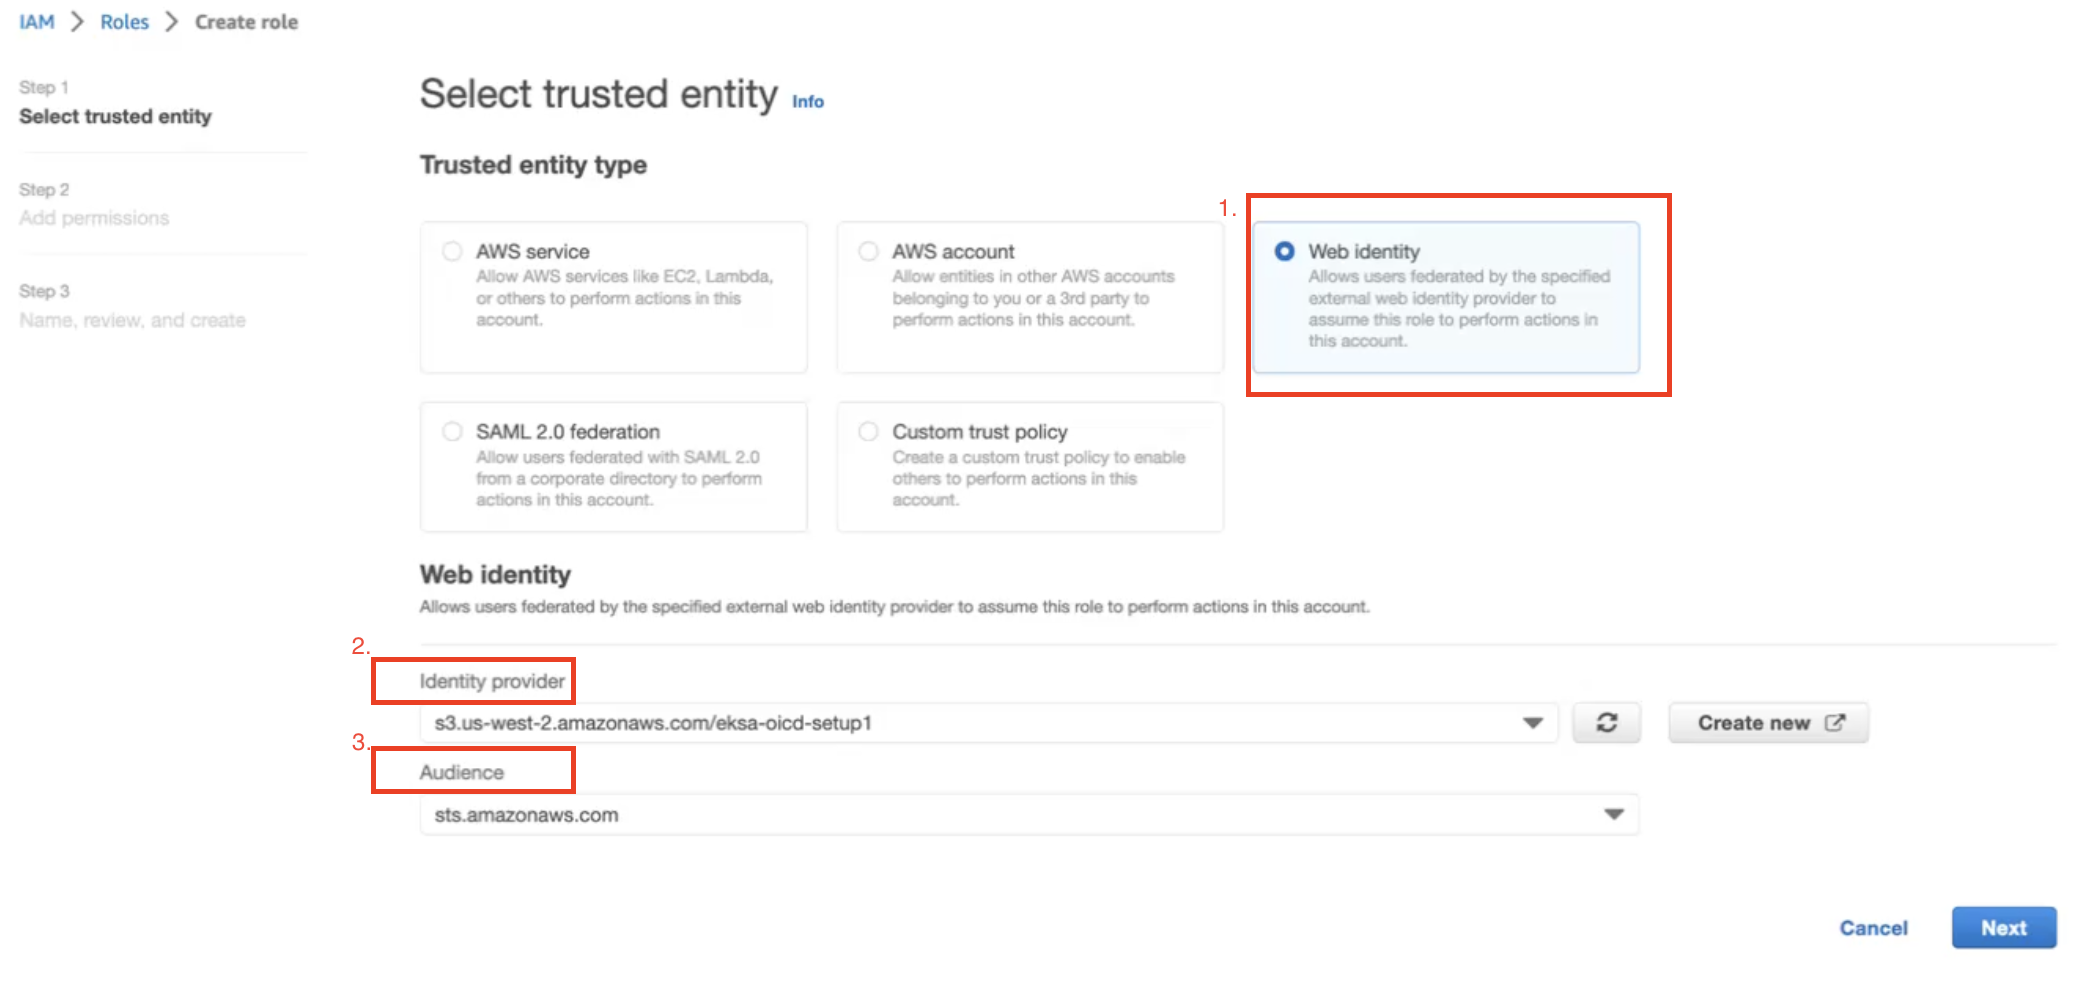
In Identity Provider, enter the OIDC provider you created as a part of IRSA configuration.
In Audience, select sts.amazonaws.com. Click on Next.
-
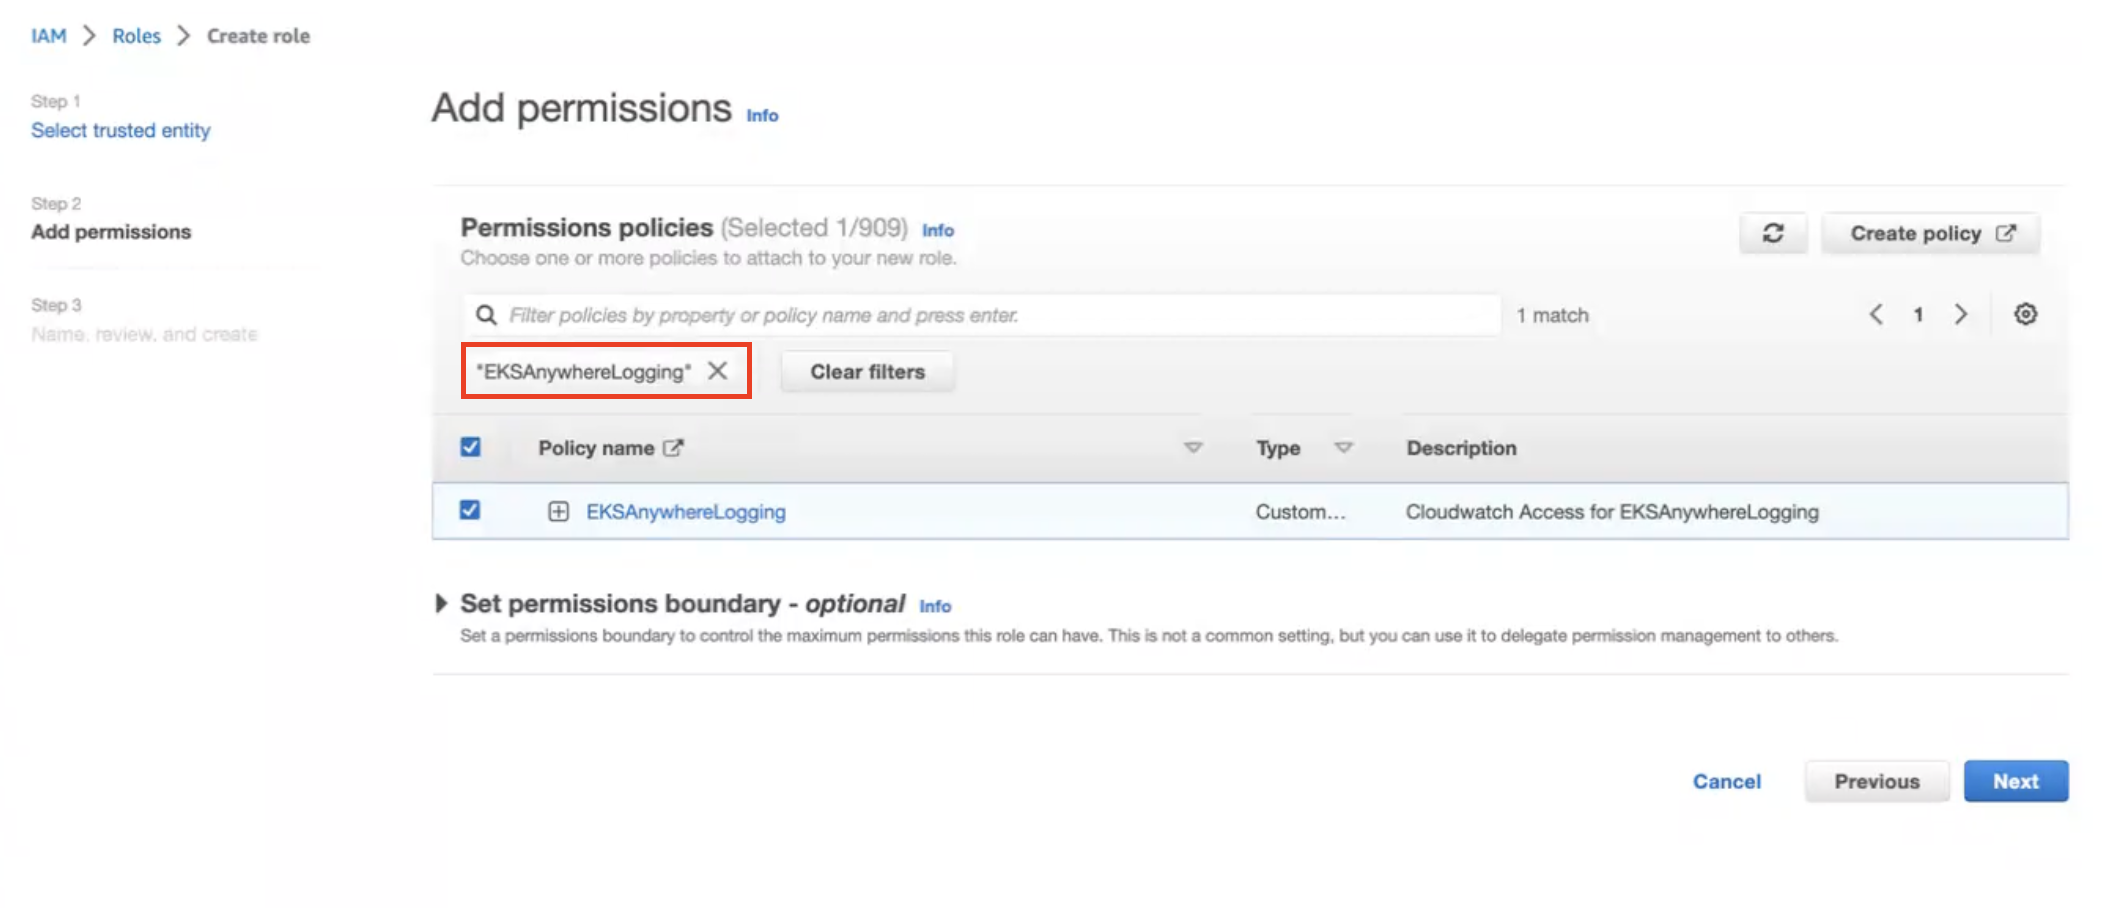
Select permission name which we have created in Create IAM Policy
-
Provide a Role name
EKSAnywhereLoggingand click Next. -
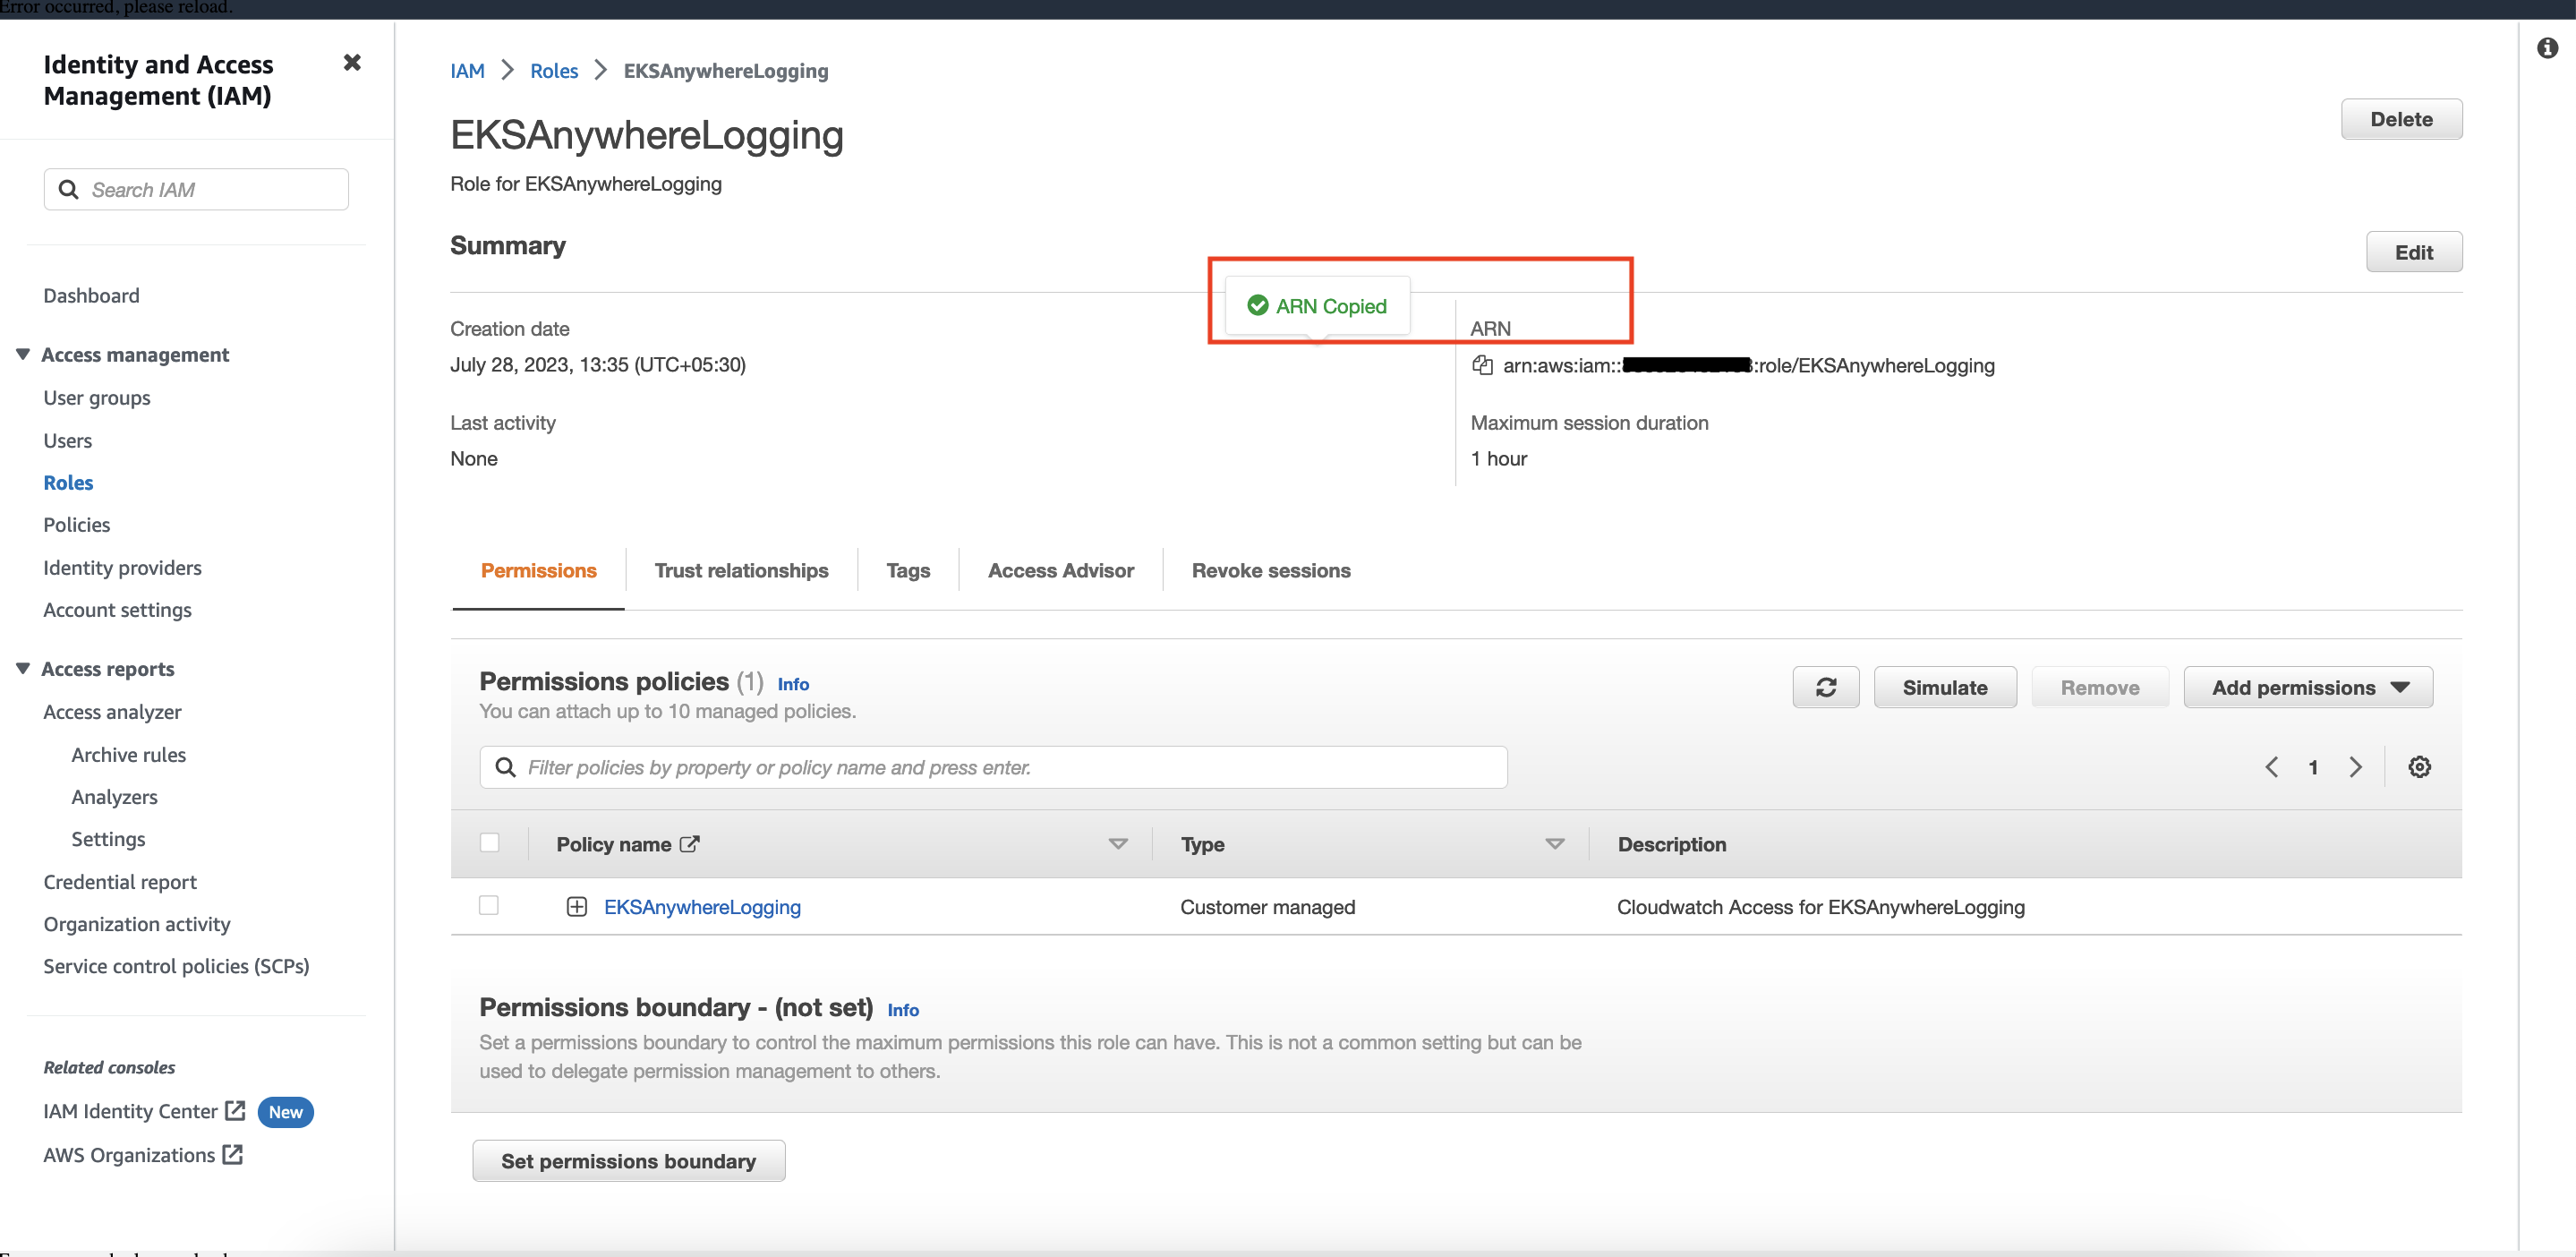
Copy the ARN as shown below and save it locally for the next step.
Step 3: Install Fluent Bit
-
Create the
amazon-cloudwatchnamespace using this command:kubectl create namespace amazon-cloudwatch -
Create the Service Account for
cloudwatch-agentandfluent-bitunder theamazon-cloudwatchnamespace. In this section, we will use Role ARN which we saved earlier . Replace$RoleARNwith your actual value.cat << EOF | kubectl apply -f - # create cwagent service account and role binding apiVersion: v1 kind: ServiceAccount metadata: name: cloudwatch-agent namespace: amazon-cloudwatch annotations: # set this with value of OIDC_IAM_ROLE eks.amazonaws.com/role-arn: "$RoleARN" # optional: Defaults to "sts.amazonaws.com" if not set eks.amazonaws.com/audience: "sts.amazonaws.com" # optional: When set to "true", adds AWS_STS_REGIONAL_ENDPOINTS env var # to containers eks.amazonaws.com/sts-regional-endpoints: "true" # optional: Defaults to 86400 for expirationSeconds if not set # Note: This value can be overwritten if specified in the pod # annotation as shown in the next step. eks.amazonaws.com/token-expiration: "86400" --- apiVersion: v1 kind: ServiceAccount metadata: name: fluent-bit namespace: amazon-cloudwatch annotations: # set this with value of OIDC_IAM_ROLE eks.amazonaws.com/role-arn: "$RoleARN" # optional: Defaults to "sts.amazonaws.com" if not set eks.amazonaws.com/audience: "sts.amazonaws.com" # optional: When set to "true", adds AWS_STS_REGIONAL_ENDPOINTS env var # to containers eks.amazonaws.com/sts-regional-endpoints: "true" # optional: Defaults to 86400 for expirationSeconds if not set # Note: This value can be overwritten if specified in the pod # annotation as shown in the next step. eks.amazonaws.com/token-expiration: "86400" EOFThe above command creates two Service Accounts:
serviceaccount/cloudwatch-agent created serviceaccount/fluent-bit created -
Now deploy Fluent Bit in your EKS Anywhere cluster to scrape and send logs to CloudWatch:
kubectl apply -f "https://anywhere.eks.amazonaws.com/manifests/fluentbit.yaml"You should see the following output:
clusterrole.rbac.authorization.k8s.io/cloudwatch-agent-role changed clusterrolebinding.rbac.authorization.k8s.io/cloudwatch-agent-role-binding changed configmap/cwagentconfig changed daemonset.apps/cloudwatch-agent changed configmap/fluent-bit-cluster-info changed clusterrole.rbac.authorization.k8s.io/fluent-bit-role changed clusterrolebinding.rbac.authorization.k8s.io/fluent-bit-role-binding changed configmap/fluent-bit-config changed daemonset.apps/fluent-bit changed -
You can verify the
DaemonSetshave been deployed with the following command:kubectl -n amazon-cloudwatch get daemonsets
-
If you are running the EKS connector , you can verify the status of
DaemonSetsby logging into AWS console and navigate to Amazon EKS -> Cluster -> Resources -> DaemonSets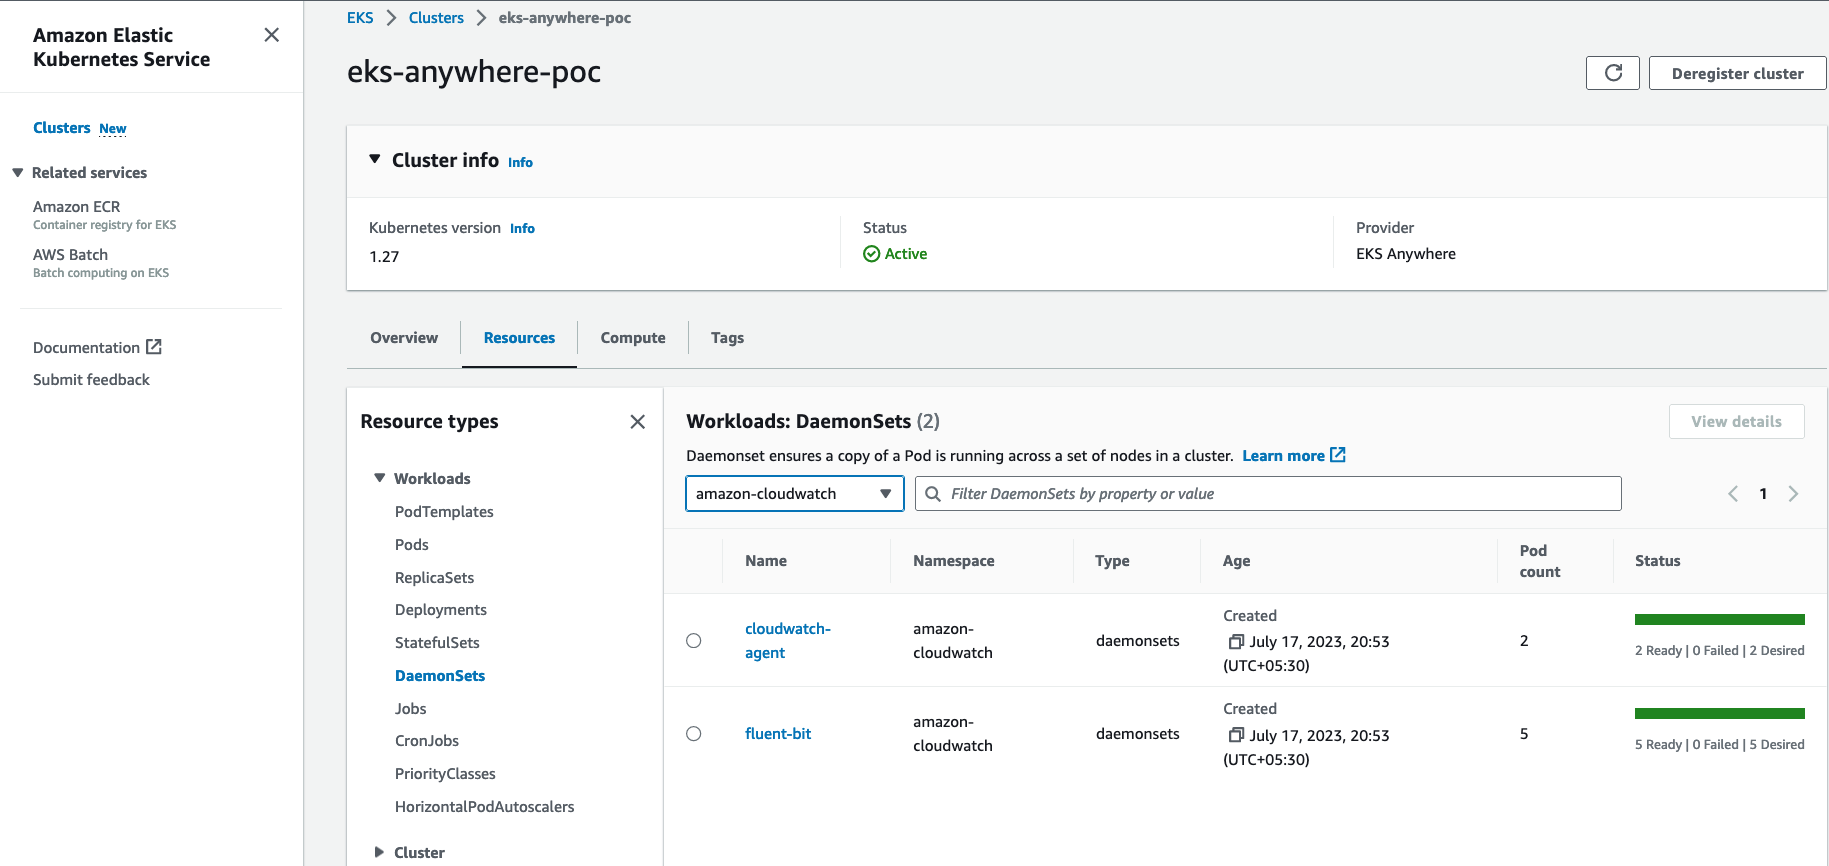
Step 4: Deploy a test application
Deploy a simple test application to verify your setup is working properly.
Step 5: View cluster logs and metrics
Cloudwatch Logs
-
Open the CloudWatch console . The link opens the console and displays your current available log groups.
-
Choose the EKS Anywhere clustername that you want to view logs for. The log group name format is /aws/containerinsights/
my-EKS-Anywhere-cluster/cluster.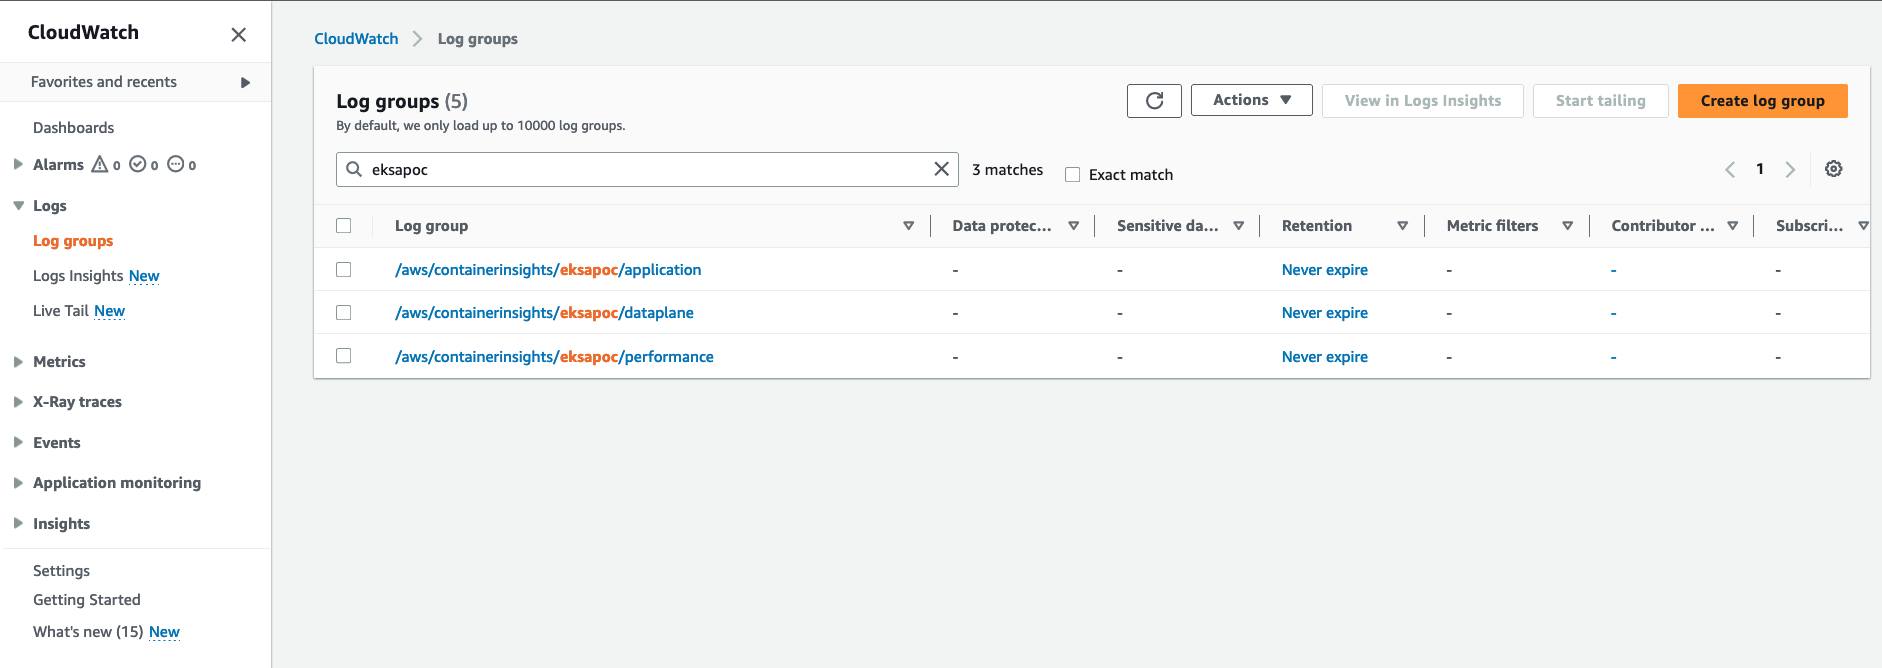
Log group name
/aws/containerinsights/my-EKS-Anywhere-cluster/applicationhas log source from /var/log/containers.Log group name
/aws/containerinsights/my-EKS-Anywhere-cluster/dataplanehas log source forkubelet.service,kubeproxy.service, anddocker.service -
To view the deployed test application logs, click on the application LogGroup, and click on Search All
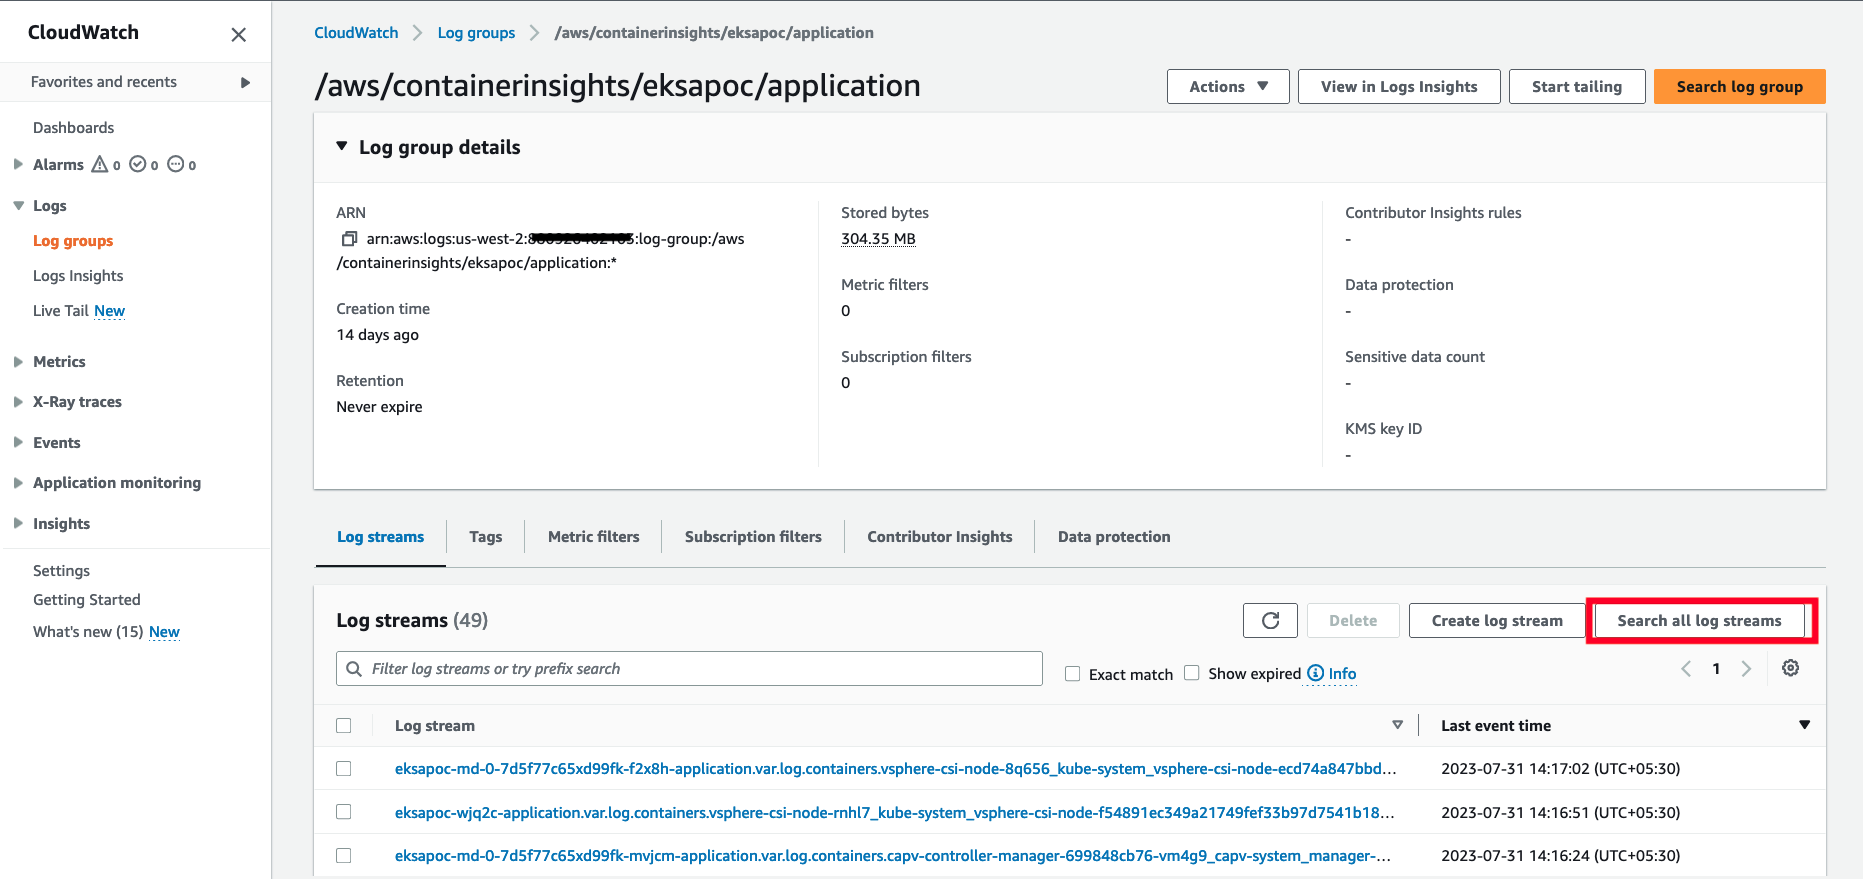
-
Type
HTTP 1.1 200in the search box and press enter. You should see logs as shown below: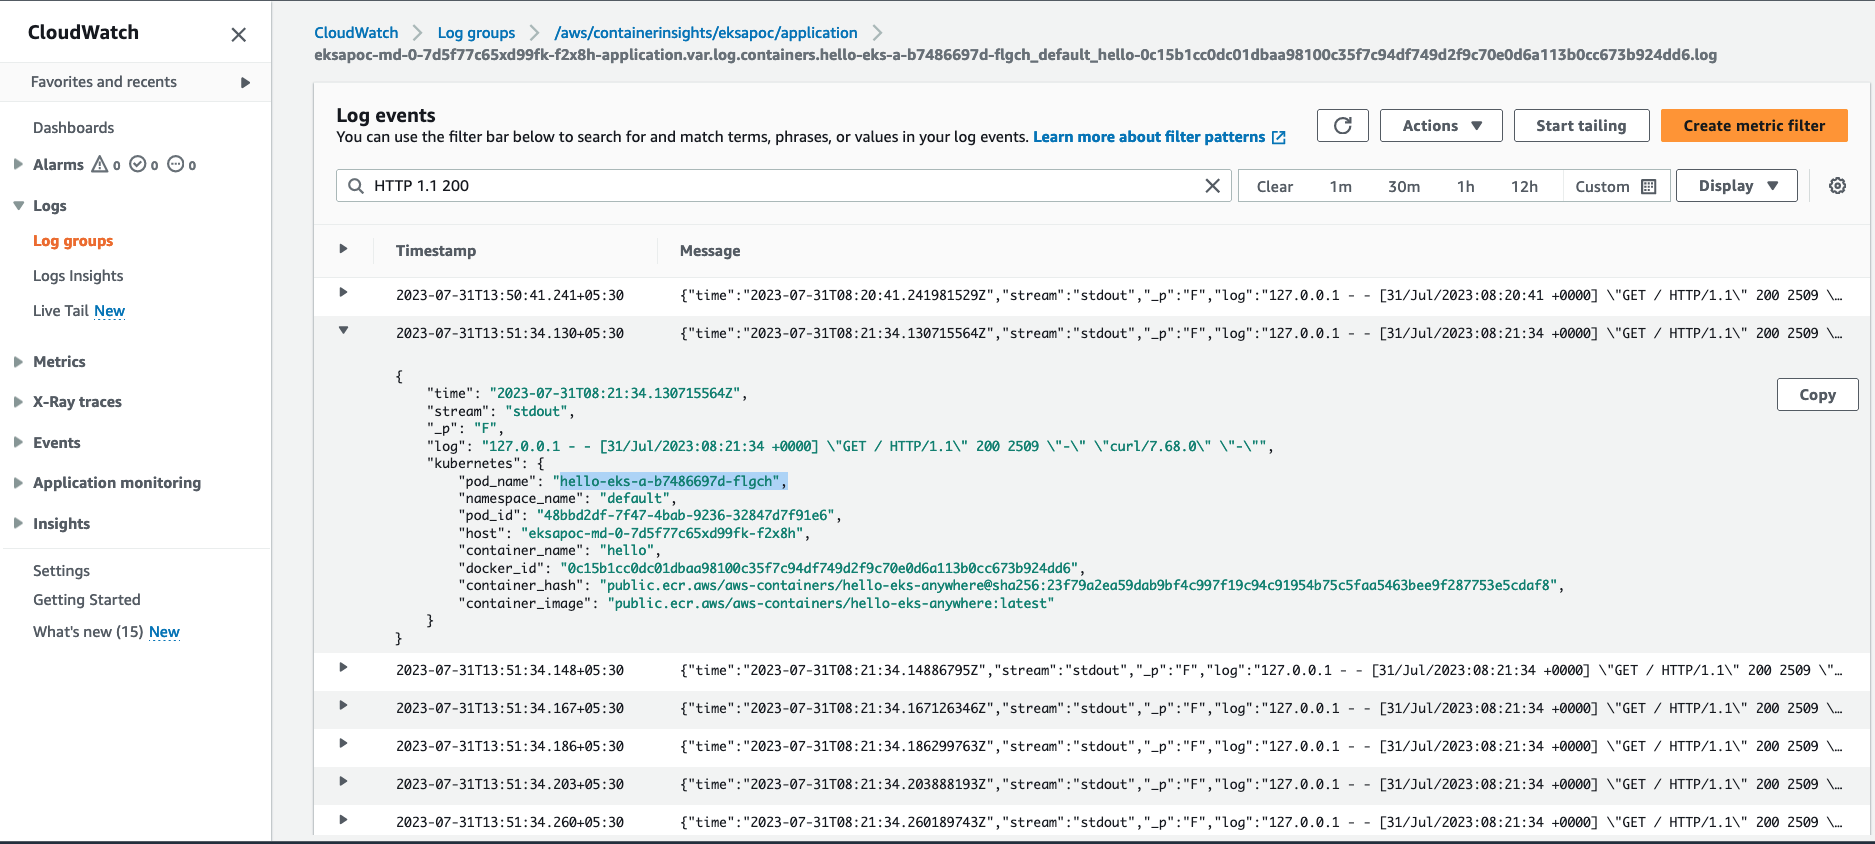
Cloudwatch Container Insights
-
Open the CloudWatch console . The link opens the Container Insights performance Monitoring console and displays a dropdown to select your
EKS Clusters.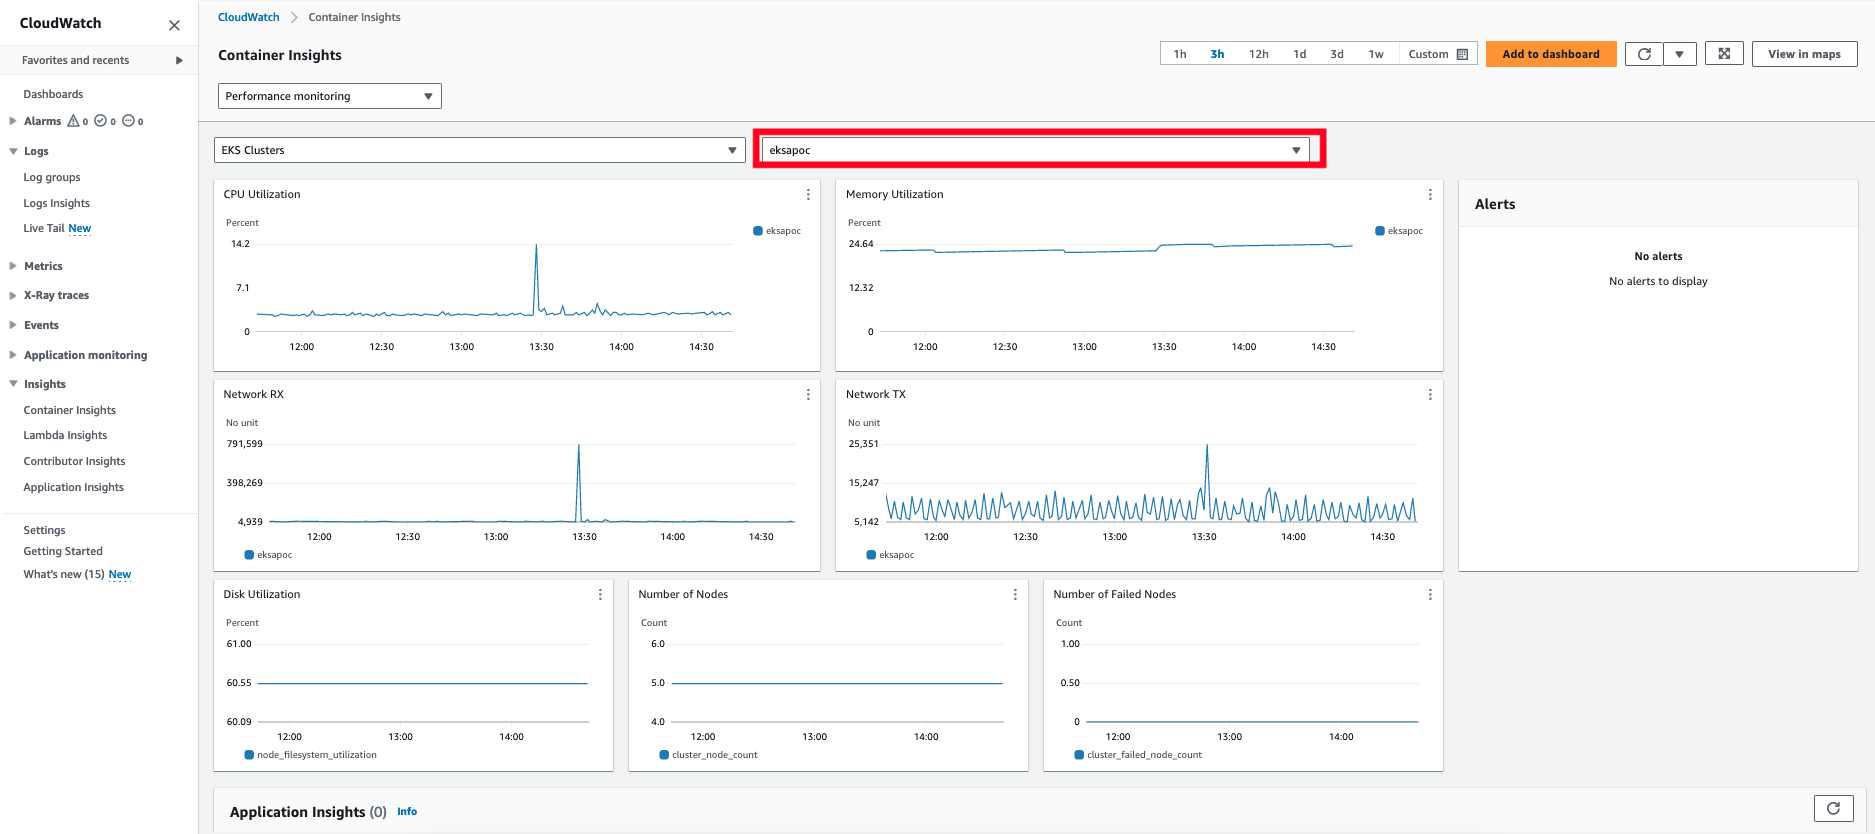
For more details on CloudWatch logs, please refer What is Amazon CloudWatch Logs?